
[अनुवाद]
समग्र अवलोकन
बहु-आयामी पिवट पॉइंट ट्रेडिंग रणनीति और गतिशील फिबोनाची संकेतक प्रणाली एक तकनीकी विश्लेषण-आधारित ट्रेडिंग रणनीति है, जो मुख्य रूप से इंट्राडे पिवट पॉइंट्स, सेंट्रल प्राइस रेंज (CPR), फिबोनाची रिट्रेसमेंट स्तर, वॉल्यूम वेटेड एवरेज प्राइस (VWAP) और मूविंग एवरेज जैसे अनेक संकेतकों का उपयोग करके संभावित खरीद और बिक्री के अवसरों की पहचान करती है। यह रणनीति इंट्राडे ट्रेडर्स के लिए उपयुक्त है, विशेष रूप से 3 मिनट के कैंडलस्टिक चार्ट पर अल्पकालिक ट्रेडिंग के लिए। रणनीति का मूल यह निर्धारित करना है कि क्या विशिष्ट शर्तों वाली कैंडलस्टिक प्रमुख समर्थन और प्रतिरोध स्तरों को छूती है, जिससे ट्रेडिंग सिग्नल उत्पन्न होता है।
यह रणनीति दैनिक उच्च, निम्न और समापन मूल्यों का उपयोग करके गणना की गई पिवट पॉइंट प्रणाली का उपयोग करती है, साथ ही गतिशील समर्थन और प्रतिरोध संदर्भ के रूप में वॉल्यूम वेटेड एवरेज प्राइस (VWAP) और मूविंग VWAP (MVWAP) का भी उपयोग करती है। साथ ही, रिलेटिव स्ट्रेंथ इंडेक्स (RSI), सिंपल मूविंग एवरेज (SMA) और एक्सपोनेंशियल मूविंग एवरेज (EMA) जैसे तकनीकी संकेतकों के माध्यम से एक व्यापक ट्रेडिंग निर्णय प्रणाली का निर्माण किया गया है।
रणनीति सबसे पहले योग्य हरी (बुलिश) और लाल (बेयरिश) कैंडलस्टिक्स की पहचान करती है, फिर यह निर्धारित करती है कि ये कैंडलस्टिक्स प्रमुख मूल्य स्तरों जैसे कि पिवट पॉइंट, समर्थन स्तर, प्रतिरोध स्तर या VWAP आदि को स्पर्श करती हैं या नहीं। जब लाल कैंडलस्टिक प्रमुख मूल्य स्तर को स्पर्श करती है, तो खरीद सिग्नल (CE) उत्पन्न होता है; जब हरी कैंडलस्टिक प्रमुख मूल्य स्तर को स्पर्श करती है, तो बिक्री सिग्नल (PE) उत्पन्न होता है। यह प्रतिकर्षण दृष्टिकोण प्रमुख मूल्य स्तरों पर संभावित रिवर्सल पॉइंट्स खोजने के मूल सिद्धांत को दर्शाता है।
रणनीति का सिद्धांत
यह रणनीति प्रमुख समर्थन और प्रतिरोध स्तरों के आसपास मूल्य में उतार-चढ़ाव के बाजार व्यवहार पर आधारित है, जिसमें कैंडलस्टिक पैटर्न, वॉल्यूम और मोमेंटम इंडिकेटर्स को ट्रेडिंग निर्णयों में शामिल किया गया है। विशिष्ट सिद्धांत का विश्लेषण निम्नलिखित है:
-
कैंडलस्टिक पहचान तंत्र:
- हरी कैंडलस्टिक (बुलिश): समापन मूल्य उद्घाटन मूल्य से अधिक होता है, कैंडलस्टिक के वास्तविक शरीर की ऊंचाई कम से कम 17 पॉइंट होती है, उद्घाटन मूल्य निम्न स्तर और 0.382 गुना कैंडलस्टिक रेंज के योग से कम होता है, समापन मूल्य निम्न स्तर और 0.682 गुना कैंडलस्टिक रेंज के योग से अधिक होता है।
- लाल कैंडलस्टिक (बेयरिश): समापन मूल्य उद्घाटन मूल्य से कम होता है, कैंडलस्टिक के वास्तविक शरीर की ऊंचाई कम से कम 17 पॉइंट होती है।
-
पिवट पॉइंट गणना प्रणाली:
- दैनिक पिवट पॉइंट (PP): (दैनिक उच्च + दैनिक निम्न + दैनिक समापन) / 3
- प्रतिरोध स्तर: R1, R2, R3, R4
- समर्थन स्तर: S1, S2, S3, S4
- सेंट्रल प्राइस रेंज (CPR): निचले CPR और ऊपरी CPR से मिलकर बनता है, जो बाजार के संभावित समेकन (कंसोलिडेशन) के मूल्य क्षेत्र को इंगित करता है
-
मूल्य के गतिशील संदर्भ:
- VWAP (वॉल्यूम वेटेड एवरेज प्राइस): वॉल्यूम कारक को ध्यान में रखने के बाद औसत मूल्य स्तर को दर्शाता है
- MVWAP (मूविंग वॉल्यूम वेटेड एवरेज प्राइस): VWAP का मूविंग एवरेज, जो एक चिकना मूल्य संदर्भ प्रदान करता है
-
सहायक संकेतक प्रणाली:
- RSI: बाजार की ओवरबॉट और ओवरसोल्ड स्थितियों को मापने के लिए उपयोग किया जाता है
- SMA (50-अवधि) और EMA (20-अवधि): मूल्य प्रवृत्ति की दिशा का संदर्भ प्रदान करते हैं
- वॉल्यूम विश्लेषण: 20-अवधि वॉल्यूम मूविंग एवरेज के माध्यम से वॉल्यूम प्रवृत्ति का मूल्यांकन किया जाता है
-
ट्रेडिंग सिग्नल उत्पादन:
- जब योग्य लाल कैंडलस्टिक किसी भी पिवट पॉइंट, समर्थन स्तर, प्रतिरोध स्तर या VWAP/MVWAP को स्पर्श करती है, तो खरीद सिग्नल (CE) उत्पन्न होता है
- जब योग्य हरी कैंडलस्टिक किसी भी पिवट पॉइंट, समर्थन स्तर, प्रतिरोध स्तर या VWAP/MVWAP को स्पर्श करती है, तो बिक्री सिग्नल (PE) उत्पन्न होता है
रणनीति का मुख्य विचार प्रमुख समर्थन और प्रतिरोध स्तरों के पास मूल्य के संभावित प्रतिकर्षण (रिवर्सल) को कैप्चर करना है, और विशिष्ट कैंडलस्टिक पैटर्न और अनेक तकनीकी संकेतकों के माध्यम से फ़िल्टर करके सिग्नल की प्रभावशीलता को बढ़ाना है। पिवट पॉइंट को स्पर्श करने वाली कैंडलस्टिक अक्सर बाजार में इन प्रमुख मूल्य स्तरों पर झिझक या रिवर्सल की संभावना को दर्शाती है।
रणनीति के लाभ
इस रणनीति के कोड का गहन विश्लेषण करने पर, हम निम्नलिखित महत्वपूर्ण लाभों को संक्षेप में प्रस्तुत कर सकते हैं:
-
बहुआयामी सत्यापन तंत्र: कई तकनीकी संकेतकों (पिवट पॉइंट, VWAP, मूविंग एवरेज, RSI) के संयोजन से ट्रेडिंग सिग्नल को सत्यापित करता है, जिससे गलत सिग्नल का जोखिम कम होता है।
-
बाजार के अनुकूल गतिशीलता: इंट्राडे पिवट पॉइंट सिस्टम प्रतिदिन अपडेट होता है, जिससे रणनीति विभिन्न बाजार वातावरण और अस्थिरता के अनुकूल हो पाती है।
-
सटीक कैंडलस्टिक पहचान: सख्त कैंडलस्टिक पैटर्न शर्तों और फिबोनाची स्तरों के माध्यम से संभावित ट्रेडिंग अवसरों को छानना, जिससे सिग्नल की गुणवत्ता में सुधार होता है।
-
लचीली प्रदर्शन सेटिंग्स: रणनीति में व्यू एडेप्टिव फीचर है, जो केवल उपयुक्त समय-सीमा (15 मिनट से कम के इंट्राडे चार्ट) पर पिवट पॉइंट प्रदर्शित करता है, जिससे चार्ट में अव्यवस्था कम होती है।
-
प्रतिकर्षण सोच का लाभ: रणनीति लाल कैंडलस्टिक द्वारा प्रमुख स्तरों को छूने पर खरीद के अवसर तलाशती है, और हरी कैंडलस्टिक द्वारा प्रमुख स्तरों को छूने पर बिक्री के अवसर तलाशती है, जो बाजार की संभावित अल्पकालिक ओवरबॉट/ओवरसोल्ड स्थिति का लाभ उठाती है।
-
पूर्ण मूल्य स्तर प्रणाली: कई स्तरों के समर्थन और प्रतिरोध (S1-S4 और R1-R4) को शामिल करती है, जो विभिन्न मूल्य उतार-चढ़ाव वाले बाजार वातावरण के लिए उपयुक्त समृद्ध संदर्भ मूल्य प्रदान करती है।
-
सेंट्रल प्राइस रेंज (CPR) का एकीकरण: CPR दिन के संभावित समेकन क्षेत्र की पहचान प्रदान करता है, जो इंट्राडे ट्रेडिंग में महत्वपूर्ण संदर्भ मूल्य रखता है।
-
दृश्य सहायता: समृद्ध मार्करों और आकृतियों के प्रदर्शन के माध्यम से, यह चार्ट पर सहज रूप से योग्य कैंडलस्टिक्स और प्रमुख मूल्य स्तरों को छूने की स्थिति को चिह्नित करता है, जिससे ट्रेडर जल्दी पहचान कर सकते हैं।
-
वॉल्यूम पुष्टि: वॉल्यूम विश्लेषण को शामिल करते हुए, वॉल्यूम मूविंग एवरेज के माध्यम से बाजार की भागीदारी का मूल्यांकन किया जाता है, जिससे सिग्नल की विश्वसनीयता बढ़ती है।
-
इंट्राडे ट्रेडिंग के लिए उपयुक्त: रणनीति विशेष रूप से छोटी समय-सीमा (विशेषकर 3 मिनट चार्ट) के लिए डिज़ाइन की गई है, जो इंट्राडे ट्रेडर्स को बाजार के उतार-चढ़ाव का लाभ उठाकर बार-बार ट्रेड करने में सक्षम बनाती है।
उपरोक्त लाभ इस रणनीति को एक व्यापक, अनुकूलनीय इंट्राडे ट्रेडिंग सिस्टम बनाते हैं, जो विशेष रूप से उन निवेशकों के लिए उपयुक्त है जिन्हें तकनीकी विश्लेषण की समझ है और वे मूल्य व्यवहार और प्रमुख मूल्य स्तरों के आधार पर ट्रेड करना चाहते हैं।
रणनीति के जोखिम
यद्यपि इस रणनीति में कई लाभ हैं, फिर भी इसमें कुछ संभावित जोखिम हैं जिनका ट्रेडर्स को सावधानी से सामना करना चाहिए:
-
अत्यधिक सिग्नल का जोखिम: कई पिवट पॉइंट्स (PP, R1-R4, S1-S4) और अन्य संकेतकों के शामिल होने के कारण, अस्थिर बाजार में अत्यधिक सिग्नल उत्पन्न हो सकते हैं, जिससे बार-बार ट्रेडिंग और शुल्क में वृद्धि हो सकती है।
- समाधान: अतिरिक्त फ़िल्टरिंग शर्तें जोड़ने पर विचार करें, जैसे ट्रेडिंग सत्र प्रतिबंध या प्रवृत्ति पुष्टि शर्तें।
-
प्रतिकर्षण ट्रेडिंग का जाल: रणनीति प्रतिकर्षण तर्क पर आधारित है (लाल कैंडलस्टिक द्वारा प्रमुख स्तर को छूने पर खरीदें, हरी कैंडलस्टिक द्वारा प्रमुख स्तर को छूने पर बेचें), जो मजबूत प्रवृत्ति वाले बाजार में लगातार नुकसान का कारण बन सकती है।
- समाधान: रणनीति का उपयोग करने से पहले समग्र बाजार प्रवृत्ति का मूल्यांकन करें, मजबूत प्रवृत्ति में प्रतिकूल ट्रेडिंग से बचने के लिए एक प्रवृत्ति फ़िल्टर जोड़ा जा सकता है।
-
पैरामीटर संवेदनशीलता: रणनीति का प्रदर्शन कैंडलस्टिक पहचान पैरामीटर्स (जैसे कैंडलस्टिक की ऊंचाई 17 पॉइंट से अधिक होनी चाहिए) और मूविंग एवरेज अवधि सेटिंग्स पर अत्यधिक निर्भर है, विभिन्न बाजार वातावरणों में अलग-अलग पैरामीटर की आवश्यकता हो सकती है।
- समाधान: विभिन्न उपकरणों और बाजार स्थितियों पर बैकटेस्ट करें और पैरामीटर सेटिंग्स को अनुकूलित करें।
-
स्टॉप-लॉस तंत्र का अभाव: कोड में स्पष्ट रूप से स्टॉप-लॉस रणनीति निर्धारित नहीं है, जिससे एकल ट्रेड में अत्यधिक नुकसान हो सकता है।
- समाधान: एक स्पष्ट स्टॉप-लॉस रणनीति लागू करें, जैसे ATR-आधारित गतिशील स्टॉप-लॉस या निश्चित पॉइंट स्टॉप-लॉस।
-
इंट्राडे रणनीति की सीमाएं: 3 मिनट चार्ट पर केंद्रित इंट्राडे रणनीति के रूप में, यह मध्यम से दीर्घकालिक धारण के लिए उपयुक्त नहीं है और संभावित दीर्घकालिक प्रवृत्ति के अवसरों को खो सकती है।
- समाधान: इस रणनीति को ट्रेडिंग सिस्टम के एक भाग के रूप में देखें और मध्यम-दीर्घकालिक रणनीतियों के साथ संयोजन में उपयोग करें।
-
पिवट पॉइंट की सीमाएं: साइडवेज़ बाजार में, मूल्य बार-बार कई पिवट पॉइंट्स को छू सकता है, जिससे भ्रमित करने वाले सिग्नल उत्पन्न हो सकते हैं।
- समाधान: समेकन बाजार में अस्थायी रूप से रणनीति बंद करने या सिग्नल पुष्टि शर्तें जोड़ने पर विचार करें।
-
वॉल्यूम भार समायोजन का अभाव: यद्यपि VWAP का उपयोग किया गया है, रणनीति वॉल्यूम के आकार के आधार पर सिग्नल भार को गतिशील रूप से समायोजित नहीं करती है।
- समाधान: वॉल्यूम थ्रेशोल्ड शर्तें जोड़ी जा सकती हैं ताकि पर्याप्त बाजार भागीदारी होने पर ही ट्रेड किया जा सके।
-
समय पर निर्भरता: दैनिक पिवट पॉइंट पिछले दिन के डेटा पर आधारित होते हैं, और नए ट्रेडिंग दिन की शुरुआत में पर्याप्त उस दिन के डेटा की कमी के कारण प्रदर्शन अस्थिर हो सकता है।
- समाधान: पर्याप्त बाजार जानकारी प्राप्त करने के लिए ट्रेडिंग दिवस शुरू होने के 30-60 मिनट बाद रणनीति को सक्रिय करने पर विचार करें।
-
स्वचालित कार्यान्वयन की चुनौती: रणनीति में कई शर्तों का निर्णय शामिल है, वास्तविक स्वचालित निष्पादन में देरी या असामयिक निष्पादन की समस्या हो सकती है।
- समाधान: निष्पादन प्रणाली को अनुकूलित करें, कम विलंबता सुनिश्चित करें, या मानव पुष्टि के साथ अर्ध-स्वचालित विधि पर विचार करें।
-
बैकटेस्ट पूर्वाग्रह का जोखिम: कोड में हरी/लाल कैंडलस्टिक पहचान तर्क बैकटेस्ट और लाइव वातावरण में अलग-अलग प्रदर्शन कर सकता है।
- समाधान: कठोर लाइव सिमुलेशन परीक्षण करें ताकि यह सुनिश्चित हो सके कि रणनीति वास्तविक ट्रेडिंग वातावरण में भी प्रभावी है।
इन जोखिमों को पहचानना और प्रबंधित करना रणनीति को सफलतापूर्वक लागू करने के लिए महत्वपूर्ण है, ट्रेडर्स को अपनी जोखिम सहनशीलता और ट्रेडिंग आदतों के अनुसार उचित समायोजन करना चाहिए।
रणनीति अनुकूलन की दिशा
कोड के गहन विश्लेषण के आधार पर, इस रणनीति के लिए अनुकूलन की प्रमुख दिशाएँ निम्नलिखित हैं:
-
गतिशील कैंडलस्टिक पहचान पैरामीटर:
- वर्तमान रणनीति प्रभावी कैंडलस्टिक की पहचान के लिए निश्चित मान (जैसे कैंडलस्टिक की ऊंचाई कम से कम 17 पॉइंट) का उपयोग करती है, इसे ATR (औसत सत्य रेंज) पर आधारित गतिशील पैरामीटर में बदला जा सकता है ताकि रणनीति विभिन्न अस्थिरता वातावरणों के लिए बेहतर अनुकूल हो सके।
- अनुकूलन का कारण: निश्चित पैरामीटर विभिन्न अस्थिरता वातावरणों में बहुत भिन्न प्रदर्शन करते हैं, गतिशील पैरामीटर रणनीति की अनुकूलनशीलता में सुधार कर सकते हैं।
-
प्रवृत्ति फ़िल्टरिंग प्रणाली:
- उच्च समय-सीमा (जैसे 15 मिनट या 30 मिनट) पर प्रवृत्ति निर्धारण जोड़ें, और केवल मुख्य प्रवृत्ति की दिशा में ट्रेड करें या सिग्नल भार को समायोजित करें।
- अनुकूलन का कारण: मजबूत प्रवृत्ति में बार-बार प्रतिकूल ट्रेडिंग से बचें, जीत दर और जोखिम-लाभ अनुपात में सुधार करें।
-
सिग्नल गुणवत्ता स्कोरिंग तंत्र:
- प्रत्येक ट्रेडिंग सिग्नल के लिए एक व्यापक स्कोरिंग सिस्टम स्थापित करें, जो कई कारकों पर विचार करे: कैंडलस्टिक की ताकत, छूए गए पिवट पॉइंट का महत्व, RSI मान, वॉल्यूम विसंगति आदि।
- अनुकूलन का कारण: सभी सिग्नल समान गुणवत्ता के नहीं होते, स्कोरिंग सिस्टम निम्न गुणवत्ता वाले सिग्नल को फ़िल्टर कर सकता है और ट्रेडिंग दक्षता में सुधार कर सकता है।
-
धन प्रबंधन एकीकरण:
- सिग्नल की ताकत और बाजार की स्थितियों के आधार पर स्थिति के आकार को गतिशील रूप से समायोजित करें, उच्च संभावना वाले अवसरों में स्थिति बढ़ाएं और कम संभावना वाली स्थितियों में जोखिम कम करें।
- अनुकूलन का कारण: प्रभावी धन प्रबंधन दीर्घकालिक लाभप्रदता के लिए महत्वपूर्ण है और रणनीति के प्रदर्शन में महत्वपूर्ण सुधार ला सकता है।
-
बहु-समय सीमा पुष्टि:
- सिग्नल उत्पन्न करने से पहले कई समय-सीमाओं पर शर्तों की स्थिरता की जांच करें, उदाहरण के लिए जब 3 मिनट और 15 मिनट चार्ट के सिग्नल संगत हों तब ट्रेड करें।
- अनुकूलन का कारण: बहु-समय सीमा पुष्टि गलत सिग्नल की संभावना को कम कर सकती है और ट्रेडिंग सटीकता में सुधार कर सकती है।
-
स्टॉप-लॉस और टेक-प्रॉफिट तंत्र:
- बुद्धिमान स्टॉप-लॉस सिस्टम लागू करें, जैसे अस्थिरता-आधारित गतिशील स्टॉप-लॉस या प्रमुख संरचनात्मक स्तरों पर स्टॉप-लॉस, साथ ही स्वचालित टेक-प्रॉफिट लक्ष्य निर्धारित करें।
- अनुकूलन का कारण: बड़े ड्रॉडाउन से बचने और लाभ की रक्षा के लिए पूर्ण जोखिम प्रबंधन आवश्यक है।
-
ट्रेडिंग समय फ़िल्टर:
- कुशल और अकुशल ट्रेडिंग सत्रों की पहचान करें, और कम अस्थिरता या अव्यवस्थित समय (जैसे दोपहर का समय या बाजार खुलने और बंद होने के आसपास) से बचें।
- अनुकूलन का कारण: विभिन्न सत्रों में बाजार व्यवहार की विशेषताएं भिन्न होती हैं, चयनात्मक ट्रेडिंग समग्र दक्षता में सुधार कर सकती है।
-
अनुकूली संकेतक पैरामीटर:
- निश्चित तकनीकी संकेतक पैरामीटर (जैसे RSI के 14 अवधि, EMA के 20 अवधि) को बाजार की स्थिति के आधार पर स्वचालित रूप से समायोजित होने वाले पैरामीटर में बदलें।
- अनुकूलन का कारण: जब बाजार की स्थितियां बदलती हैं, तो इष्टतम संकेतक पैरामीटर भी तदनुसार समायोजित होने चाहिए, जिससे संकेतक की संवेदनशीलता में सुधार होता है।
-
बाजार वातावरण वर्गीकरण:
- वर्तमान बाजार वातावरण (प्रवृत्ति, समेकन, उच्च अस्थिरता आदि) को स्वचालित रूप से पहचानने के लिए एल्गोरिदम जोड़ें, और विभिन्न वातावरणों के लिए अलग-अलग पैरामीटर सेटिंग्स लागू करें।
- अनुकूलन का कारण: एकल पैरामीटर सेटिंग सभी बाजार वातावरणों में सर्वश्रेष्ठ प्रदर्शन नहीं कर सकती, वातावरण-अनुकूली समायोजन रणनीति की स्थिरता में काफी सुधार कर सकता है।
-
मशीन लर्निंग संवर्धन:
- ऐतिहासिक पैटर्न पहचान के आधार पर सिग्नल की सफलता की संभावना का पूर्वानुमान लगाने के लिए मशीन लर्निंग मॉडल को शामिल करने पर विचार करें, ट्रेडिंग सिग्नलों को छानने और प्राथमिकता देने के लिए।
- अनुकूलन का तर्क: मशीन लर्निंग मानव के लिए पहचानने में कठिन जटिल पैटर्न खोज सकती है, जिससे रणनीति की बुद्धिमत्ता का स्तर बढ़ जाता है।
उपरोक्त अनुकूलन दिशाओं को लागू करके, यह रणनीति अपने मूल लाभों को बनाए रखते हुए, अनुकूलनशीलता, सटीकता और दीर्घकालिक लाभप्रदता में उल्लेखनीय सुधार कर सकती है, और विभिन्न बाजार स्थितियों की चुनौतियों का बेहतर ढंग से सामना कर सकती है।
सारांश
बहु-आयामी पिवट पॉइंट ट्रेडिंग रणनीति और गतिशील फाइबोनैचि संकेतक प्रणाली एक व्यापक, अच्छी तरह से संरचित दिवसीय ट्रेडिंग रणनीति प्रणाली है। यह पारंपरिक तकनीकी विश्लेषण उपकरणों (पिवट पॉइंट, फाइबोनैचि रिट्रेसमेंट, मूविंग एवरेज) को आधुनिक गतिशील संकेतकों (VWAP, CPR) के साथ कुशलतापूर्वक जोड़ती है, और सख्त कैंडल स्थितियों के फ़िल्टरिंग और बहु-संकेतक पुष्टि के माध्यम से, व्यापारियों को एक संभावित दिवसीय ट्रेडिंग ढांचा प्रदान करती है।
इस रणनीति का मुख्य लाभ प्रमुख मूल्य स्तरों का व्यापक कवरेज और संभावित उलट बिंदुओं के प्रति संवेदनशील पकड़ है। सख्त कैंडल पहचान शर्तों को निर्धारित करके, रणनीति बड़ी मात्रा में अर्थहीन बाजार शोर को फ़िल्टर कर सकती है, और उच्च संभावना वाले ट्रेडिंग अवसरों पर ध्यान केंद्रित कर सकती है। साथ ही, वॉल्यूम और मोमेंटम संकेतकों के उपयोग से सिग्नलों की विश्वसनीयता और बढ़ जाती है।
हालाँकि, रणनीति की कुछ सीमाएँ भी हैं, जैसे संभावित रूप से अत्यधिक सिग्नल, रिवर्स ट्रेडिंग जोखिम और पैरामीटर अनुकूलन चुनौतियाँ। इन मुद्दों के समाधान के लिए, हम गतिशील पैरामीटर समायोजन, बहु-समय सीमा पुष्टि, बुद्धिमान धन प्रबंधन और बाजार वातावरण अनुकूलन सहित कई अनुकूलन दिशाएँ प्रस्तावित करते हैं। ये अनुकूलन व्यापारियों को अपनी आवश्यकताओं और बाजार विशेषताओं के अनुसार रणनीति को समायोजित करने और समग्र ट्रेडिंग परिणामों में सुधार करने में मदद कर सकते हैं।
यह ध्यान रखना महत्वपूर्ण है कि कोई भी ट्रेडिंग रणनीति "पत्थर को सोने में बदलने" का उपकरण नहीं है। सफल ट्रेडिंग रणनीति पर निर्भर होने के अलावा, व्यापारी के धैर्य, अनुशासन और निरंतर सीखने की भी आवश्यकता होती है। इस रणनीति के लिए, सुझाव दिया जाता है कि व्यापारी पहले सिमुलेशन वातावरण में इसका पर्याप्त परीक्षण करें, विभिन्न बाजार स्थितियों में इसके प्रदर्शन की विशेषताओं से परिचित हों, धीरे-धीरे विशिष्ट ट्रेडिंग उपकरणों और व्यक्तिगत शैली के अनुसार मापदंडों को समायोजित करें, और अंततः एक व्यक्तिगत, स्थायी रूप से लाभदायक ट्रेडिंग सिस्टम बनाएं।
निरंतर अभ्यास, प्रतिक्रिया और अनुकूलन के माध्यम से, बहु-आयामी पिवट पॉइंट ट्रेडिंग रणनीति और गतिशील फाइबोनैचि संकेतक प्रणाली दिवसीय व्यापारियों के टूलबॉक्स में एक शक्तिशाली हथियार बन सकती है, जो दिवसीय बाजार की अस्थिरता को भुनाने के लिए एक विश्वसनीय तकनीकी विश्लेषण ढांचा प्रदान करती है।
Overview
The Multi-Dimensional Pivot Point Trading System with Dynamic Fibonacci Indicators is a technical analysis-based trading strategy that utilizes daily pivot points, Central Pivot Range (CPR), Fibonacci retracement levels, Volume Weighted Average Price (VWAP), and moving averages to identify potential buying and selling opportunities. This strategy is particularly suitable for intraday traders, especially those focusing on 3-minute chart timeframes. The core of the strategy is determining whether candles meeting specific conditions touch key support and resistance levels, thereby triggering trading signals.
The strategy employs a pivot point system calculated from daily high, low, and close prices, combined with Volume Weighted Average Price (VWAP) and Moving VWAP (MVWAP) as dynamic support and resistance references. It also incorporates technical indicators such as the Relative Strength Index (RSI), Simple Moving Average (SMA), and Exponential Moving Average (EMA) to create a comprehensive trading decision system.
The strategy first identifies qualifying green (bullish) and red (bearish) candles, then determines if these candles touch key price levels such as pivot points, support levels, resistance levels, or VWAP. When a red candle touches a key price level, it triggers a buy signal (CE); when a green candle touches a key price level, it triggers a sell signal (PE). This contrarian approach reflects the core concept of seeking potential reversal points at key price levels.
Strategy Principles
The principles of this strategy are built on market behavior where prices fluctuate around key support and resistance levels, combined with candle patterns, volume, and momentum indicators for trading decisions. The specific principles are analyzed as follows:
-
Candle Identification Mechanism:
- Green Candle (Bullish): Close higher than open, candle body height at least 17 points, open lower than low plus 0.382 times candle range, close higher than low plus 0.682 times candle range.
- Red Candle (Bearish): Close lower than open, candle body height at least 17 points.
-
Pivot Point Calculation System:
- Daily Pivot Point (PP): (Daily High + Daily Low + Daily Close) / 3
- Resistance Levels: R1, R2, R3, R4
- Support Levels: S1, S2, S3, S4
- Central Pivot Range (CPR): Comprised of bottom CPR and top CPR, providing a price region where the market may consolidate
-
Dynamic Price References:
- VWAP (Volume Weighted Average Price): Reflects the average price level considering volume factors
- MVWAP (Moving Volume Weighted Average Price): Moving average of VWAP, providing a smoother price reference
-
Auxiliary Indicator System:
- RSI: Used to measure market overbought/oversold conditions
- SMA (50-period) and EMA (20-period): Provide price trend direction references
- Volume Analysis: Assesses volume trends through 20-period volume moving average
-
ट्रेड सिग्नल जनरेशन:
- जब योग्य लाल मोमबत्तियाँ किसी पिवट पॉइंट, सपोर्ट लेवल, रेसिस्टेंस लेवल, या VWAP/MVWAP को छूती हैं, तो एक खरीद सिग्नल (CE) उत्पन्न होता है
- जब योग्य हरी मोमबत्तियाँ किसी पिवट पॉइंट, सपोर्ट लेवल, रेसिस्टेंस लेवल, या VWAP/MVWAP को छूती हैं, तो एक बेच सिग्नल (PE) उत्पन्न होता है
रणनीति का मुख्य विचार प्रमुख सपोर्ट और रेसिस्टेंस स्तरों के निकट संभावित उलटफेर को पकड़ना है, जिसे विशिष्ट मोमबत्ती पैटर्न और कई तकनीकी संकेतकों के माध्यम से फ़िल्टर किया जाता है ताकि सिग्नल की वैधता बढ़े। पिवट पॉइंट्स को छूने वाली मोमबत्तियाँ अक्सर इन प्रमुख मूल्य स्तरों पर बाजार में हिचकिचाहट या उलटफेर की बढ़ी हुई संभावना का संकेत देती हैं।
रणनीति के लाभ
रणनीति कोड के गहन विश्लेषण से निम्नलिखित महत्वपूर्ण लाभ सामने आते हैं:
-
बहुआयामी सत्यापन तंत्र: ट्रेडिंग सिग्नल को मान्य करने के लिए कई तकनीकी संकेतकों (पिवट पॉइंट्स, VWAP, मूविंग एवरेज, RSI) को जोड़ता है, जिससे गलत सिग्नल का जोखिम कम होता है।
-
गतिशील बाजार अनुकूलन: दैनिक पिवट पॉइंट सिस्टम प्रतिदिन अपडेट होता है, जिससे रणनीति विभिन्न बाजार वातावरणों और अस्थिरताओं के अनुकूल हो सकती है।
-
सटीक मोमबत्ती पहचान: सख्त मोमबत्ती पैटर्न शर्तों और फिबोनाची स्तरों के माध्यम से संभावित ट्रेडिंग अवसरों को छानता है, जिससे सिग्नल की गुणवत्ता में सुधार होता है।
-
लचीली प्रदर्शन सेटिंग्स: रणनीति में दृश्य अनुकूलन कार्यक्षमता है, जो केवल उपयुक्त समय-सीमाओं (15 मिनट से नीचे के इंट्राडे चार्ट) में पिवट पॉइंट्स प्रदर्शित करती है, जिससे चार्ट में अव्यवस्था कम होती है।
-
प्रतिधारा सोच का लाभ: रणनीति लाल मोमबत्तियों के प्रमुख स्तरों को छूने पर खरीदने के अवसर और हरी मोमबत्तियों के प्रमुख स्तरों को छूने पर बेचने के अवसर तलाशती है, जो बाजार की संभावित अल्पकालिक ओवरबॉट/ओवरसोल्ड स्थितियों का लाभ उठाती है।
-
पूर्ण मूल्य स्तर पदानुक्रम: सपोर्ट और रेसिस्टेंस के कई स्तर (S1-S4 और R1-R4) शामिल हैं, जो विभिन्न अस्थिरता श्रेणियों वाले बाजार वातावरणों के लिए उपयुक्त समृद्ध संदर्भ मूल्य प्रदान करते हैं।
-
एकीकृत केंद्रीय पिवट रेंज (CPR): CPR दिन के लिए संभावित समेकन क्षेत्रों की पहचान प्रदान करता है, जिसका इंट्राडे ट्रेडिंग में महत्वपूर्ण संदर्भ मूल्य होता है।
-
दृश्य सहायता: समृद्ध मार्कर और आकृतियों के माध्यम से, चार्ट पर योग्य मोमबत्तियों और प्रमुख मूल्य स्तरों को छूने के उदाहरणों को सहज रूप से चिह्नित किया जाता है, जिससे व्यापारी उन्हें तुरंत पहचान सकते हैं।
-
वॉल्यूम पुष्टिकरण: वॉल्यूम विश्लेषण को शामिल करता है, वॉल्यूम मूविंग एवरेज के माध्यम से बाजार की भागीदारी का आकलन करता है, जिससे सिग्नल विश्वसनीयता बढ़ती है।
-
इंट्राडे ट्रेडिंग के लिए उपयुक्त: रणनीति विशेष रूप से छोटी समय-सीमाओं (विशेषकर 3 मिनट के चार्ट) के लिए डिज़ाइन की गई है, जो उन इंट्राडे व्यापारियों के लिए उपयुक्त है जो बार-बार ट्रेडिंग के माध्यम से बाजार में उतार-चढ़ाव का लाभ उठाना चाहते हैं।
ये लाभ इस रणनीति को एक मजबूत, अनुकूलनीय इंट्राडे ट्रेडिंग सिस्टम बनाते हैं, विशेष रूप से उन निवेशकों के लिए जिन्हें तकनीकी विश्लेषण की अच्छी समझ है और वे मूल्य कार्रवाई और प्रमुख मूल्य स्तरों के आधार पर ट्रेड करना चाहते हैं।
रणनीति के जोखिम
इसके कई लाभों के बावजूद, रणनीति में कई संभावित जोखिम भी हैं जिन्हें व्यापारियों को ध्यान से संबोधित करना चाहिए:
-
अत्यधिक सिग्नल जोखिम: चूंकि रणनीति में कई पिवट पॉइंट्स (PP, R1-R4, S1-S4) और अन्य संकेतक शामिल हैं, इसलिए अस्थिर बाजारों में यह बहुत अधिक सिग्नल उत्पन्न कर सकती है, जिससे बार-बार ट्रेडिंग और बढ़ी हुई फीस हो सकती है।
- समाधान: अतिरिक्त फ़िल्टरिंग शर्तों पर विचार करें, जैसे ट्रेडिंग सत्र सीमाएँ या प्रवृत्ति पुष्टिकरण शर्तें।
-
प्रतिधारा ट्रेडिंग ट्रैप: रणनीति प्रतिधारा तर्क पर आधारित है (लाल मोमबत्तियों के प्रमुख स्तरों को छूने पर खरीदें, हरी मोमबत्तियों के प्रमुख स्तरों को छूने पर बेचें), जो मजबूत ट्रेंडिंग बाजारों में लगातार नुकसान का कारण बन सकती है।
- समाधान: रणनीति का उपयोग करने से पहले समग्र बाजार प्रवृत्ति का आकलन करें, और मजबूत प्रवृत्तियों में प्रवृत्ति के विपरीत ट्रेडिंग से बचने के लिए प्रवृत्ति फ़िल्टर जोड़ें।
-
पैरामीटर संवेदनशीलता: रणनीति की प्रभावशीलता कैंडल पहचान पैरामीटर (जैसे, कैंडल की ऊंचाई 17 अंक से अधिक होनी चाहिए) और मूविंग एवरेज अवधि सेटिंग्स पर अत्यधिक निर्भर करती है, जिन्हें विभिन्न बाजार वातावरणों में अलग-अलग पैरामीटर की आवश्यकता हो सकती है।
- समाधान: पैरामीटर सेटिंग्स को अनुकूलित करने के लिए विभिन्न उपकरणों और बाजार स्थितियों पर बैकटेस्ट करें।
-
स्टॉप-लॉस तंत्र का अभाव: कोड में कोई स्पष्ट स्टॉप-लॉस रणनीति निर्धारित नहीं है, जिससे एकल ट्रेड में अत्यधिक नुकसान हो सकता है।
- समाधान: स्पष्ट स्टॉप-लॉस रणनीतियों को लागू करें, जैसे ATR आधारित गतिशील स्टॉप-लॉस या निर्धारित बिंदु स्टॉप-लॉस।
-
इंट्राडे रणनीति की सीमाएं: 3 मिनट के चार्ट पर केंद्रित रणनीति होने के कारण, यह मध्यम से दीर्घकालिक होल्डिंग के लिए उपयुक्त नहीं है, जिससे लंबी अवधि के रुझानों में अवसर चूक सकते हैं।
- समाधान: इस रणनीति को व्यापार प्रणाली के एक भाग के रूप में देखें, जिसे मध्यम और दीर्घकालिक रणनीतियों के साथ संयोजन में उपयोग किया जाए।
-
पिवट पॉइंट सीमाएं: रेंज-बाउंड बाजारों में, कीमतें बार-बार कई पिवट पॉइंट को छू सकती हैं, जिससे भ्रमित करने वाले संकेत उत्पन्न होते हैं।
- समाधान: एकीकृत बाजारों में अस्थायी रूप से रणनीति को अक्षम करने या सिग्नल पुष्टिकरण शर्तों को जोड़ने पर विचार करें।
-
वॉल्यूम भार समायोजन का अभाव: VWAP का उपयोग करने के बावजूद, रणनीति वॉल्यूम आकार के आधार पर सिग्नल भार को गतिशील रूप से समायोजित नहीं करती है।
- समाधान: वॉल्यूम थ्रेशोल्ड शर्तें जोड़ें ताकि यह सुनिश्चित हो सके कि व्यापार पर्याप्त बाजार भागीदारी के साथ होता है।
-
समय निर्भरता: दैनिक पिवट पॉइंट पिछले दिन के डेटा पर आधारित होते हैं, और एक नए व्यापारिक दिन की शुरुआत में अपर्याप्त वर्तमान दिन के डेटा के कारण अस्थिर प्रदर्शन कर सकते हैं।
- समाधान: पर्याप्त बाजार जानकारी एकत्र करने के लिए व्यापारिक दिन शुरू होने के 30-60 मिनट बाद रणनीति को सक्षम करने पर विचार करें।
-
ऑटोमेशन कार्यान्वयन चुनौतियां: रणनीति में कई स्थिति निर्णय शामिल हैं, और वास्तविक स्वचालित निष्पादन के दौरान देरी या असामयिक निष्पादन का सामना करना पड़ सकता है।
- समाधान: कम विलंबता सुनिश्चित करने के लिए निष्पादन प्रणालियों को अनुकूलित करें, या मैन्युअल पुष्टिकरण के साथ संयुक्त अर्ध-स्वचालित विधियों पर विचार करें।
-
बैकटेस्ट पूर्वाग्रह जोखिम: कोड में हरे/लाल कैंडल पहचान तर्क बैकटेस्ट और लाइव ट्रेडिंग वातावरण के बीच असंगत प्रदर्शन कर सकता है।
- समाधान: यह सुनिश्चित करने के लिए कठोर लाइव सिमुलेशन परीक्षण करें कि रणनीति वास्तविक व्यापारिक वातावरण में प्रभावी बनी रहे।
इन जोखिमों को पहचानना और प्रबंधित करना इस रणनीति को सफलतापूर्वक लागू करने के लिए महत्वपूर्ण है। व्यापारियों को अपनी जोखिम सहनशीलता और व्यापारिक आदतों के आधार पर उचित समायोजन करना चाहिए।
रणनीति अनुकूलन दिशाएं
कोड के गहन विश्लेषण के आधार पर, इस रणनीति को अनुकूलित करने के लिए निम्नलिखित प्रमुख दिशाएं हैं:
-
गतिशील कैंडल पहचान पैरामीटर:
- वर्तमान रणनीति प्रभावी कैंडल की पहचान करने के लिए निश्चित मानों (जैसे कैंडल की ऊंचाई कम से कम 17 अंक) का उपयोग करती है। इसे ATR (औसत सत्य सीमा) पर आधारित गतिशील पैरामीटर में बदला जा सकता है ताकि विभिन्न अस्थिरता वातावरणों के लिए बेहतर अनुकूलन हो सके।
- अनुकूलन तर्क: निश्चित पैरामीटर विभिन्न अस्थिरता वातावरणों में अलग-अलग प्रदर्शन करते हैं; गतिशील पैरामीटर रणनीति की अनुकूलन क्षमता में सुधार कर सकते हैं।
-
रुझान फ़िल्टरिंग प्रणाली:
- केवल मुख्य रुझान की दिशा में व्यापार करने या सिग्नल भार को समायोजित करने के लिए उच्च समय सीमा (जैसे 15 मिनट या 30 मिनट) से रुझान निर्धारण जोड़ें।
- अनुकूलन तर्क: मजबूत रुझानों में बार-बार प्रवृत्ति के विपरीत व्यापार से बचें, जीत दर और जोखिम-लाभ अनुपात में सुधार करें।
-
सिग्नल गुणवत्ता स्कोरिंग तंत्र:
- प्रत्येक व्यापारिक संकेत के लिए एक व्यापक स्कोरिंग प्रणाली स्थापित करें, जिसमें कैंडल की ताकत, छूए गए पिवट पॉइंट का महत्व, RSI मान, वॉल्यूम विसंगतियां आदि जैसे कई कारकों पर विचार किया जाए।
- अनुकूलन तर्क: सभी संकेत समान गुणवत्ता के नहीं होते हैं; एक स्कोरिंग प्रणाली निम्न-गुणवत्ता वाले संकेतों को फ़िल्टर कर सकती है और व्यापारिक दक्षता में सुधार कर सकती है।
-
पूंजी प्रबंधन एकीकरण:
- सिग्नल की ताकत और बाजार की स्थितियों के आधार पर पोजीशन के आकार को गतिशील रूप से समायोजित करें, उच्च-संभावना वाले अवसरों पर पोजीशन बढ़ाएं और कम-संभावना वाली स्थितियों में जोखिम जोखिम कम करें।
- अनुकूलन का तर्क: दीर्घकालिक लाभप्रदता के लिए प्रभावी पूंजी प्रबंधन महत्वपूर्ण है और यह रणनीति के प्रदर्शन में उल्लेखनीय सुधार ला सकता है।
-
एकाधिक समय-सीमा पुष्टि:
- सिग्नल उत्पन्न करने से पहले एकाधिक समय-सीमाओं पर स्थितियों की एकरूपता की जांच करें, उदाहरण के लिए, केवल तब व्यापार करें जब 3-मिनट और 15-मिनट के चार्ट के सिग्नल एक-दूसरे से मेल खाते हों।
- अनुकूलन का तर्क: एकाधिक समय-सीमा पुष्टि झूठे सिग्नलों की संभावना को कम कर सकती है और व्यापार की सटीकता में सुधार कर सकती है।
-
स्टॉप-लॉस और टेक-प्रॉफिट तंत्र:
- बुद्धिमान स्टॉप-लॉस प्रणाली लागू करें, जैसे अस्थिरता-आधारित गतिशील स्टॉप-लॉस या प्रमुख संरचनात्मक स्थिति स्टॉप-लॉस, साथ ही स्वचालित टेक-प्रॉफिट लक्ष्य निर्धारित करें।
- अनुकूलन का तर्क: बड़ी गिरावट से बचने और मुनाफे की सुरक्षा के लिए ठोस जोखिम प्रबंधन महत्वपूर्ण है।
-
व्यापार समय फिल्टर:
- कुशल और अकुशल व्यापार सत्रों की पहचान करें, कम बाजार अस्थिरता या अव्यवस्थित अवधियों (जैसे दोपहर के भोजन के घंटे या बाजार खुलने और बंद होने से पहले और बाद का समय) से बचें।
- अनुकूलन का तर्क: विभिन्न सत्रों में बाजार के व्यवहार की विशेषताएं भिन्न होती हैं; चयनात्मक व्यापार समग्र दक्षता में सुधार कर सकता है।
-
अनुकूली संकेतक पैरामीटर:
- निश्चित तकनीकी संकेतक मापदंडों (जैसे 14-अवधि RSI, 20-अवधि EMA) को ऐसे मापदंडों में बदलें जो बाजार की स्थिति के आधार पर स्वचालित रूप से समायोजित होते हैं।
- अनुकूलन का तर्क: जब बाजार की स्थितियां बदलती हैं, तो इष्टतम संकेतक मापदंडों को भी तदनुसार समायोजित होना चाहिए, जिससे संकेतक की संवेदनशीलता में सुधार होता है।
-
बाजार पर्यावरण वर्गीकरण:
- वर्तमान बाजार परिवेश (ट्रेंडिंग, कंसोलिडेटिंग, उच्च अस्थिरता, आदि) की स्वचालित रूप से पहचान करने के लिए एल्गोरिदम जोड़ें और विभिन्न परिवेशों के लिए अलग-अलग पैरामीटर सेटिंग्स लागू करें।
- अनुकूलन का तर्क: एकल पैरामीटर सेटिंग्स सभी बाजार परिवेशों में बेहतर प्रदर्शन करने में कठिनाई पैदा करती हैं; पर्यावरण-अनुकूली समायोजन रणनीति की स्थिरता को महत्वपूर्ण रूप से बढ़ा सकता है।
-
मशीन लर्निंग संवर्धन:
- सिग्नल सफलता की संभावना का अनुमान लगाने के लिए मशीन लर्निंग मॉडल को एकीकृत करने पर विचार करें, ऐतिहासिक पैटर्न पहचान के आधार पर ट्रेडिंग सिग्नलों को फ़िल्टर और प्राथमिकता दें।
- अनुकूलन का तर्क: मशीन लर्निंग मनुष्यों के लिए पहचानना मुश्किल जटिल पैटर्न की खोज कर सकता है, जिससे रणनीति का बौद्धिक स्तर बढ़ जाता है।
इन अनुकूलन दिशाओं को लागू करके, रणनीति अपने मूल लाभों को बनाए रखते हुए अनुकूलन क्षमता, सटीकता और दीर्घकालिक लाभप्रदता में उल्लेखनीय सुधार कर सकती है, और विभिन्न बाजार स्थितियों में चुनौतियों का बेहतर ढंग से सामना कर सकती है।
सारांश
डायनामिक फिबोनाची इंडिकेटर्स के साथ मल्टी-डायमेंशनल पिवट पॉइंट ट्रेडिंग सिस्टम एक व्यापक, सुव्यवस्थित इंट्राडे ट्रेडिंग रणनीति प्रणाली है। यह पारंपरिक तकनीकी विश्लेषण उपकरणों (पिवट पॉइंट, फिबोनाची रिट्रेसमेंट, मूविंग एवरेज) को आधुनिक गतिशील संकेतकों (VWAP, CPR) के साथ कुशलता से जोड़ता है। सख्त कैंडल स्थिति स्क्रीनिंग और एकाधिक संकेतक पुष्टि के माध्यम से, यह व्यापारियों को एक आशाजनक इंट्राडे ट्रेडिंग ढांचा प्रदान करता है।
इस रणनीति का मुख्य लाभ प्रमुख मूल्य स्तरों के व्यापक कवरेज और संभावित उलट बिंदुओं की संवेदनशील पकड़ में निहित है। सख्त कैंडल पहचान शर्तें निर्धारित करके, रणनीति बड़ी मात्रा में अर्थहीन बाजार शोर को फ़िल्टर कर सकती है और उच्च-संभावना वाले ट्रेडिंग अवसरों पर ध्यान केंद्रित कर सकती है। साथ ही, वॉल्यूम और मोमेंटम इंडिकेटर्स का उपयोग सिग्नल विश्वसनीयता को और बढ़ाता है।
हालांकि, इस रणनीति की कुछ सीमाएँ भी हैं, जैसे संभावित रूप से अत्यधिक संकेत, विरोधी प्रवृत्ति व्यापार जोखिम, और पैरामीटर अनुकूलन चुनौतियाँ। इन मुद्दों को हल करने के लिए, हमने कई अनुकूलन दिशाएँ प्रस्तावित की हैं, जिनमें गतिशील पैरामीटर समायोजन, बहु-समय-सीमा पुष्टि, बुद्धिमान पूंजी प्रबंधन, और बाजार पर्यावरण अनुकूलन शामिल हैं। ये अनुकूलन व्यापारियों को अपनी आवश्यकताओं और बाजार की विशेषताओं के अनुसार रणनीति को समायोजित करने में मदद कर सकते हैं, जिससे समग्र व्यापार प्रभावशीलता में सुधार होता है।
यह ध्यान देने योग्य है कि कोई भी ट्रेडिंग रणनीति 'जादुई गोली' नहीं है। सफल व्यापार केवल रणनीति पर ही निर्भर नहीं करता, बल्कि व्यापारी के धैर्य, अनुशासन और निरंतर सीखने पर भी निर्भर करता है। इस रणनीति के लिए, यह सिफारिश की जाती है कि व्यापारी पहले एक सिम्युलेटेड वातावरण में इसका पूरी तरह से परीक्षण करें, विभिन्न बाजार स्थितियों में इसके प्रदर्शन की विशेषताओं से परिचित हों, धीरे-धीरे विशिष्ट ट्रेडिंग इंस्ट्रूमेंट्स और व्यक्तिगत शैलियों के अनुकूल होने के लिए पैरामीटर समायोजित करें, और अंततः एक व्यक्तिगत, स्थायी रूप से लाभदायक ट्रेडिंग सिस्टम बनाएं।
निरंतर अभ्यास, प्रतिक्रिया और अनुकूलन के माध्यम से, डायनेमिक फिबोनाची इंडिकेटर्स के साथ मल्टी-डायमेंशनल पिवट पॉइंट ट्रेडिंग सिस्टम एक इंट्राडे ट्रेडर के टूलबॉक्स में एक शक्तिशाली हथियार बन सकता है, जो अल्पकालिक बाजार अवसरों को पकड़ने के लिए एक विश्वसनीय तकनीकी विश्लेषण ढांचा प्रदान करता है।
रणनीति का पारंपरिक पिवट पॉइंट्स को आधुनिक तकनीकी टूल्स के साथ एकीकरण एक संतुलित दृष्टिकोण बनाता है जो बाजार संरचना का सम्मान करता है जबकि इंट्राडे मूल्य आंदोलनों के प्रति उत्तरदायी रहता है। महत्वपूर्ण स्तरों पर मुख्य मूल्य अंतःक्रियाओं पर ध्यान केंद्रित करके, व्यापारी बाजार मनोविज्ञान की गहरी समझ विकसित कर सकते हैं और संभावित रूप से अपने ट्रेडिंग प्रदर्शन में सुधार कर सकते हैं।
अंततः, सफल कार्यान्वयन के लिए विचारशील अनुकूलन, कठोर परीक्षण और अनुशासित निष्पादन की आवश्यकता होगी। जब एक व्यापक ट्रेडिंग योजना के हिस्से के रूप में उचित रूप से लागू किया जाता है जिसमें ठोस जोखिम प्रबंधन सिद्धांत शामिल होते हैं, तो यह रणनीति अधिक आत्मविश्वास और सटीकता के साथ इंट्राडे बाजारों की जटिलताओं को नेविगेट करने के लिए एक व्यवस्थित विधि प्रदान करती है।
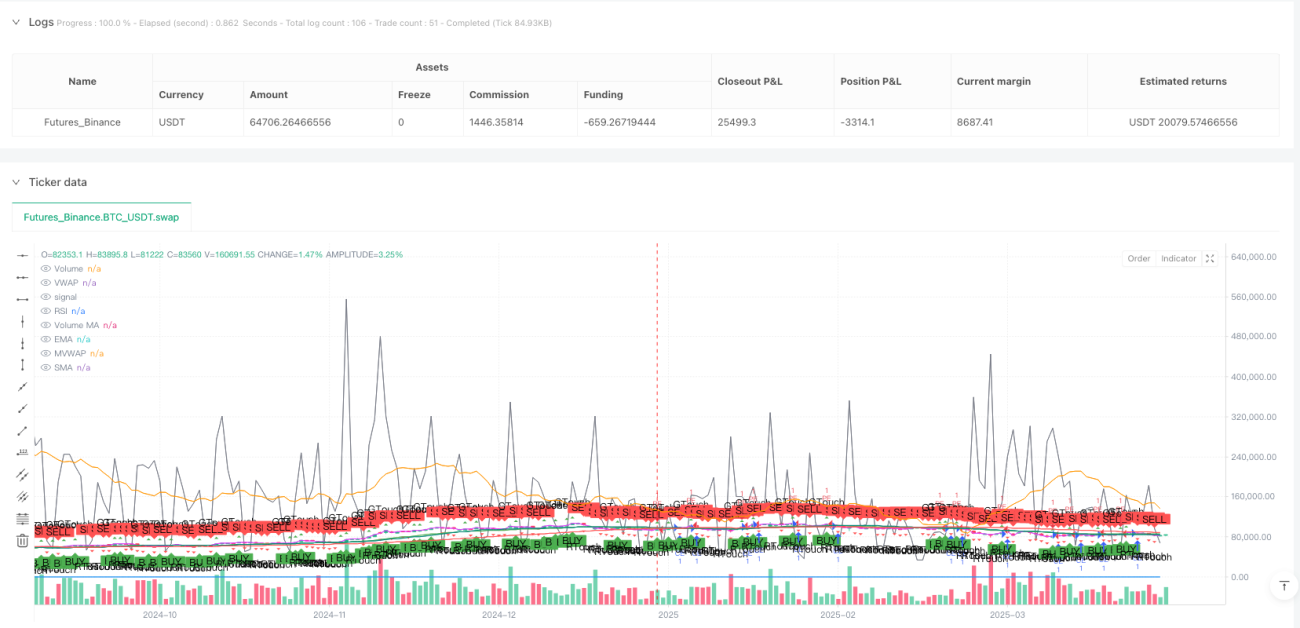
/*backtest
start: 2025-01-01 00:00:00
end: 2025-04-01 00:00:00
period: 1d
basePeriod: 1d
exchanges: [{"eid":"Futures_Binance","currency":"BTC_USDT"}]
*/

//@version=5
strategy("Pivot Point CE/PE Strategy", overlay=true)

// Identify 3-minute candles (Assuming the script is applied to a 3-minute chart)- 1