Strategi Rata-rata Biaya Dolar Bollinger Band Pembalikan Rata-rata

Ringkasan
Strategi ini adalah strategi investasi cerdas yang menggabungkan nilai rata-rata biaya dolar (DCA) dan indikator teknologi Bollinger Bands. Strategi ini berinvestasi dengan menggunakan prinsip regresi rata-rata dengan membangun posisi secara sistematis selama penurunan harga. Inti dari strategi ini adalah melakukan pembelian dengan jumlah tetap ketika harga turun dari Bollinger Bands, sehingga mendapatkan harga masuk yang lebih baik selama periode penyesuaian pasar.
Prinsip Strategi
Prinsip-prinsip inti dari strategi ini didasarkan pada tiga dasar: 1) rata-rata biaya dolar, yang mengurangi risiko saat pilihan dengan menginvestasikan jumlah tetap secara berkala; 2) teori regresi rata-rata, yang menganggap bahwa harga akhirnya akan kembali ke tingkat rata-rata historisnya; 3) indikator Bollinger Bands, yang digunakan untuk mengidentifikasi zona overbought oversold. Ketika harga menembus Bollinger Bands, sinyal pembelian dipicu, jumlah pembelian dibagi dengan jumlah investasi yang ditetapkan untuk menentukan harga saat ini.
Keunggulan Strategis
- Menurunkan risiko saat memilih - mengurangi kesalahan manusia dengan membeli secara sistematis dan bukan dengan penilaian subjektif
- Mengambil kesempatan untuk melakukan reset - melakukan pembelian secara otomatis saat harga melampaui batas
- Fleksibel pengaturan parameter - dapat menyesuaikan parameter Brinks dan jumlah investasi sesuai dengan kondisi pasar yang berbeda
- Aturan masuk dan keluar yang jelas - sinyal obyektif berdasarkan indikator teknis
- Eksekusi otomatis - menghindari transaksi emosional tanpa intervensi manusia
Risiko Strategis
- Resiko resonansi nilai rata-rata gagal - mungkin menghasilkan lebih banyak sinyal palsu di pasar tren
- Risiko pengelolaan dana - perlu menyisihkan dana yang cukup untuk menanggapi sinyal pembelian berturut-turut
- Risiko optimasi parameter - optimasi berlebihan dapat menyebabkan kegagalan strategi
- Ketergantungan pada kondisi pasar - mungkin kurang baik dalam pasar yang sangat bergejolak
Untuk mengelola risiko-risiko ini, disarankan untuk menerapkan sistem manajemen dana yang ketat dan melakukan evaluasi kinerja strategi secara teratur.
Arah optimasi strategi
- Memperkenalkan filter tren untuk menghindari operasi berlawanan arah dalam tren yang kuat
- Menambahkan mekanisme pengesahan siklus waktu ganda
- Mengoptimalkan sistem manajemen dana, menyesuaikan jumlah investasi sesuai dengan dinamika fluktuasi
- Menambahkan profit yang terikat dengan harga yang terikat dengan nilai rata-rata yang kembali
- Pertimbangkan untuk meningkatkan reliabilitas sinyal dengan menggabungkan indikator teknis lainnya
Meringkaskan
Ini adalah strategi yang kuat yang menggabungkan analisis teknis dengan metode investasi yang sistematis. Mengidentifikasi peluang overshoot dan overshoot melalui Brin membawa, bekerja sama dengan rata-rata biaya dolar untuk mengurangi risiko. Kunci keberhasilan strategi adalah pengaturan parameter yang masuk akal dan disiplin pelaksanaan yang ketat.
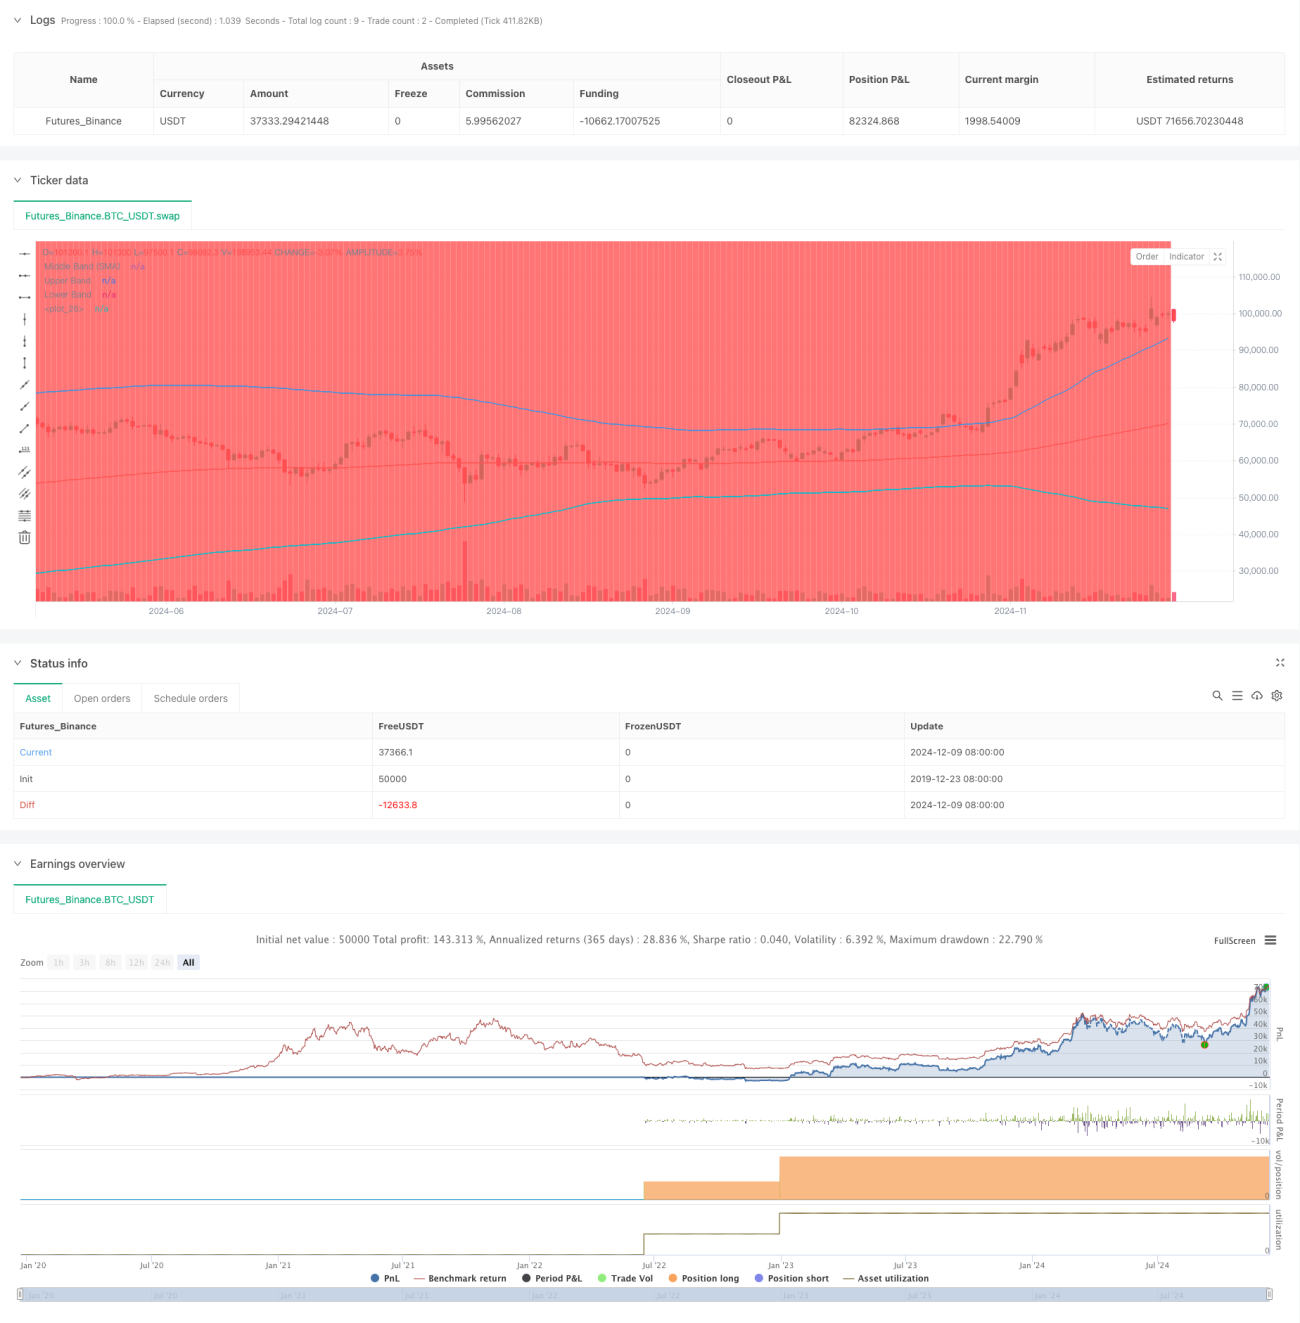
/*backtest
start: 2019-12-23 08:00:00
end: 2024-12-10 08:00:00
period: 1d
basePeriod: 1d
exchanges: [{"eid":"Futures_Binance","currency":"BTC_USDT"}]
*/

//@version=5
strategy("DCA Strategy with Mean Reversion and Bollinger Band", overlay=true) // Define the strategy name and set overlay=true to display on the main chart

// Inputs for investment amount and dates- 1