Mean Reversion Bollinger Band Dollar-Cost Averaging Investment Strategy

Overview
This strategy is an intelligent investment approach that combines Dollar-Cost Averaging (DCA) with Bollinger Bands technical indicator. It systematically builds positions during price pullbacks by leveraging mean reversion principles. The core mechanism executes fixed-amount purchases when prices break below the lower Bollinger Band, aiming to achieve better entry prices during market corrections.
Strategy Principles
The strategy is built on three fundamental pillars: 1) Dollar-Cost Averaging, which reduces timing risk through regular fixed-amount investments; 2) Mean Reversion Theory, which assumes prices will eventually return to their historical average; 3) Bollinger Bands indicator for identifying overbought and oversold zones. Buy signals are triggered when price breaks below the lower band, with purchase quantity determined by dividing the set investment amount by current price. The strategy employs a 200-period EMA as the middle band with a standard deviation multiplier of 2 to define the upper and lower bands.
Strategy Advantages
- Reduced Timing Risk - Systematic buying rather than subjective judgment reduces human error
- Capturing Pullbacks - Automatic execution of purchases during oversold conditions
- Flexible Parameters - Adjustable Bollinger Band parameters and investment amounts for different market conditions
- Clear Entry/Exit Rules - Objective signals based on technical indicators
- Automated Execution - No manual intervention needed, avoiding emotional trading
Strategy Risks
- Mean Reversion Failure Risk - May generate false signals in trending markets
- Capital Management Risk - Requires sufficient capital reserve for consecutive buy signals
- Parameter Optimization Risk - Over-optimization may lead to strategy failure
- Market Environment Dependency - May underperform in highly volatile markets
Recommended to implement strict capital management rules and regularly evaluate strategy performance to manage these risks.
Strategy Optimization Directions
- Incorporate trend filters to avoid counter-trend operations in strong trends
- Add multiple timeframe confirmation mechanisms
- Optimize capital management system with volatility-based position sizing
- Implement profit-taking mechanisms when price reverts to mean
- Consider combining with other technical indicators to improve signal reliability
Summary
This is a robust strategy that combines technical analysis with systematic investment methods. It uses Bollinger Bands to identify oversold opportunities while implementing Dollar-Cost Averaging to reduce risk. The key to success lies in proper parameter settings and strict execution discipline. While risks exist, continuous optimization and risk management can improve strategy stability.
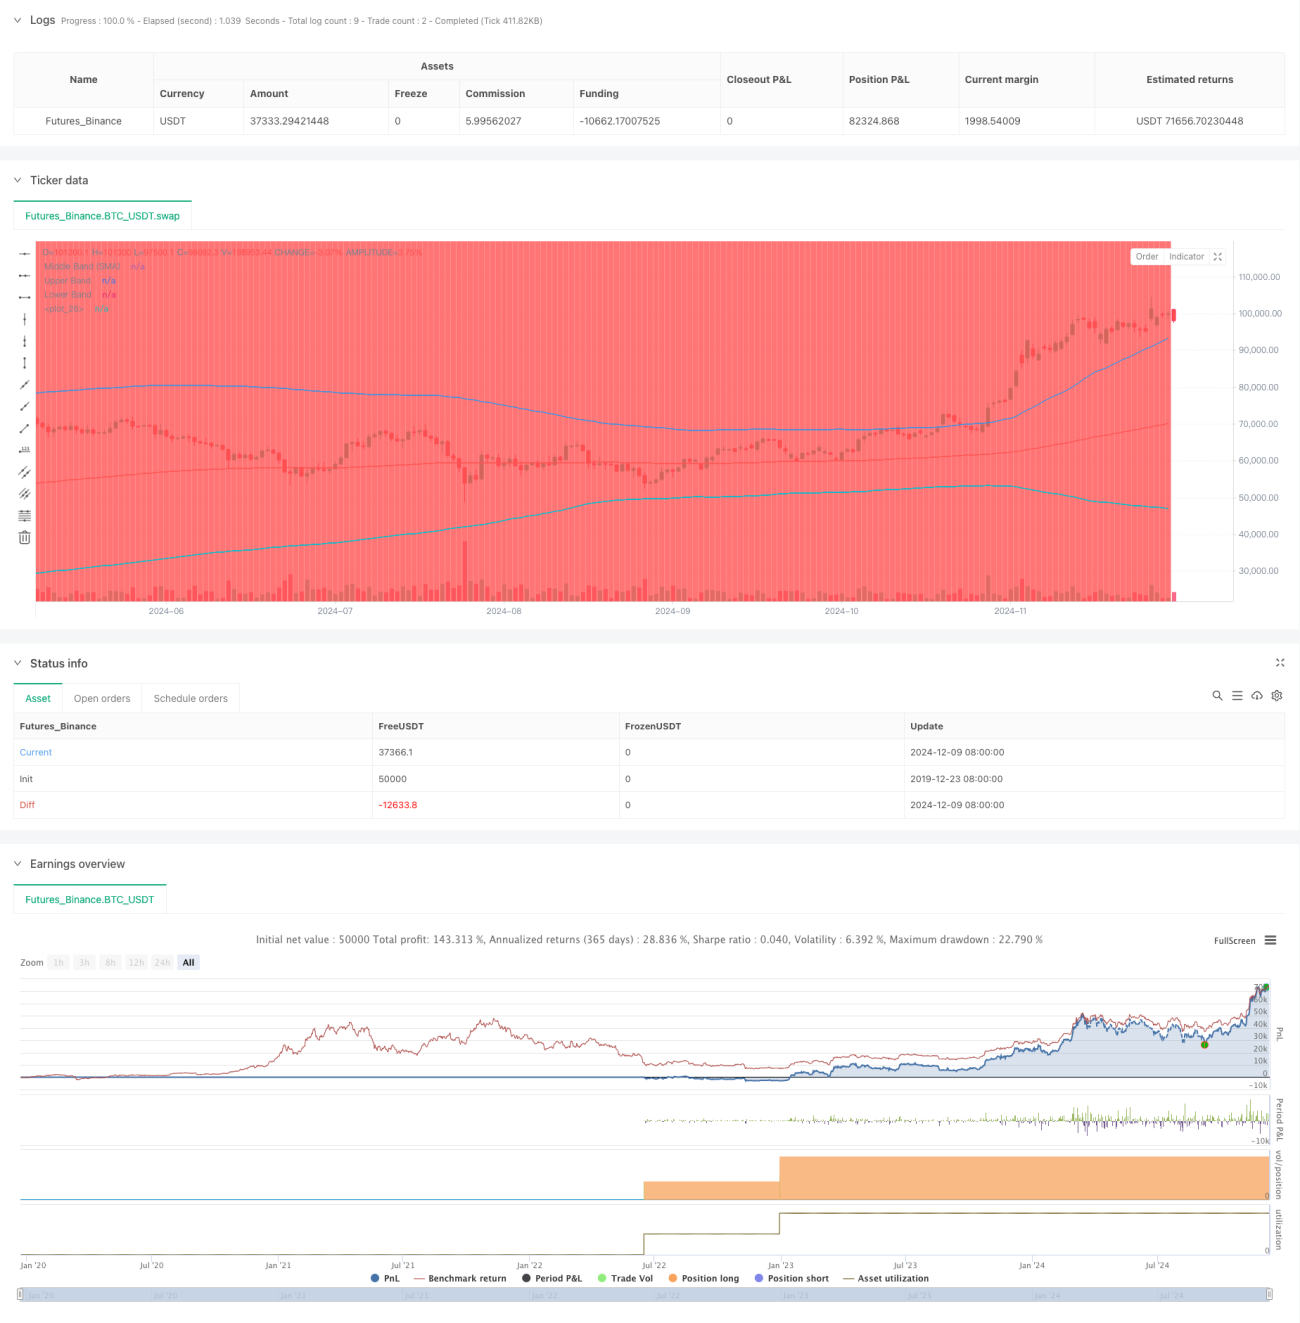
/*backtest
start: 2019-12-23 08:00:00
end: 2024-12-10 08:00:00
period: 1d
basePeriod: 1d
exchanges: [{"eid":"Futures_Binance","currency":"BTC_USDT"}]
*/

//@version=5
strategy("DCA Strategy with Mean Reversion and Bollinger Band", overlay=true) // Define the strategy name and set overlay=true to display on the main chart

// Inputs for investment amount and dates- 1