
Overview
This strategy is a trend-following system that combines Bollinger Bands and EMA indicators with a multi-layer risk control mechanism to optimize trading performance. The core strategy utilizes Bollinger Bands breakout-reversion patterns to capture market trends while incorporating an EMA trend filter to enhance trading accuracy. The system includes a comprehensive risk management framework with trailing stops, fixed stop losses, profit targets, and time-based position closure.
Strategy Principles
The trading logic is based on the following core elements:
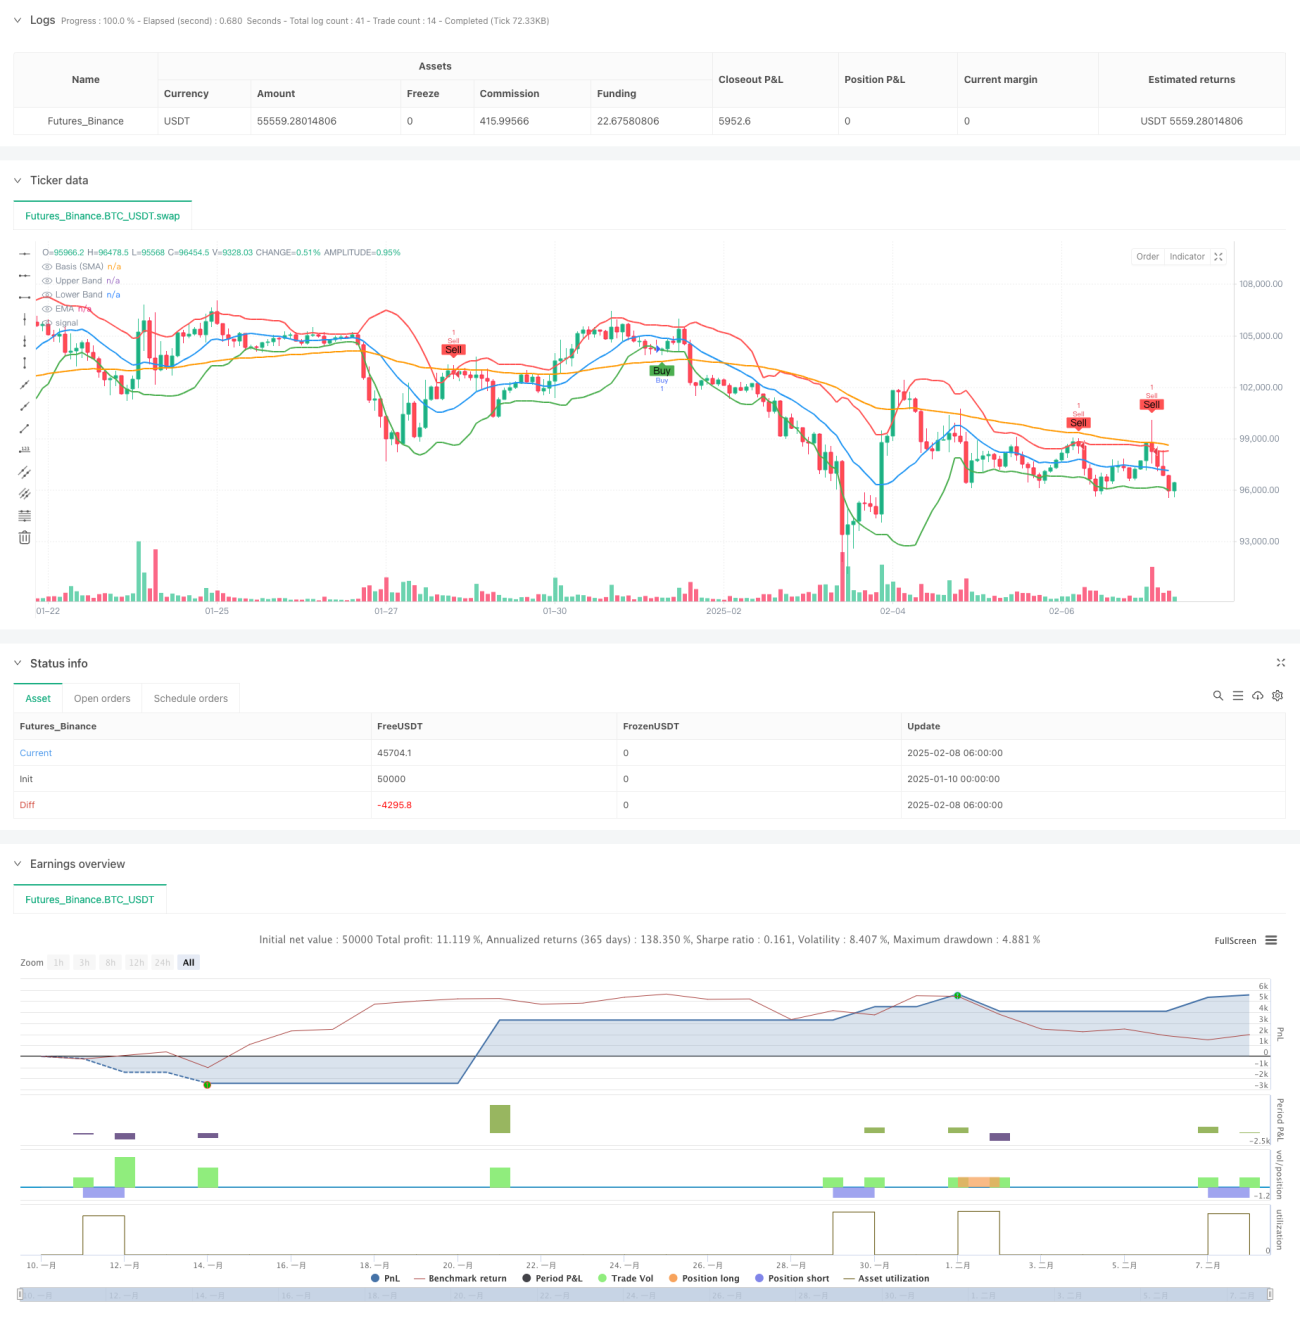
- Uses Bollinger Bands with 1.5 standard deviation and 14-period length as the primary trading signal indicator
- Triggers short signals when the previous candle closes above the upper band and current candle reverses
- Triggers long signals when the previous candle closes below the lower band and current candle turns bullish
- Optionally applies an 80-period EMA as a trend filter, only entering positions when trend direction aligns
- Activates trailing stops when price crosses the Bollinger Bands middle line
- Allows setting fixed stop loss and take profit amounts
- Supports automatic position closure based on bar count
Strategy Advantages
- Combines trend-following and reversal trading characteristics for stable performance across different market conditions
- Multi-layered risk control system provides comprehensive money management
- Flexible parameter settings allow strategy adaptation to different market conditions
- EMA filter effectively reduces false breakout risks
- Trailing stop mechanism effectively locks in profits
- Time-dimensional closure mechanism prevents long-term position trapping
Strategy Risks
- May generate frequent false breakout signals in ranging markets
- Fixed monetary stop losses may not suit all market conditions
- EMA filtering might cause missing important trading opportunities
- Trailing stops may close positions prematurely in highly volatile markets
- Parameter optimization may lead to overfitting historical data
Strategy Optimization Directions
- Introduce adaptive Bollinger Bands periods based on market volatility
- Develop dynamic stop-loss system based on money management
- Add volume analysis to confirm breakout validity
- Implement intelligent parameter optimization system
- Add market environment recognition module for different parameter settings in different market conditions
Summary
This is a well-designed trend-following system that provides reliable trading signals through the combination of Bollinger Bands and EMA, while ensuring trading safety through multi-layered risk control. The strategy offers strong configurability to adapt to different trading styles and market environments. While there are some inherent risks, the suggested optimization directions can further enhance the strategy's stability and profitability.
- 1