
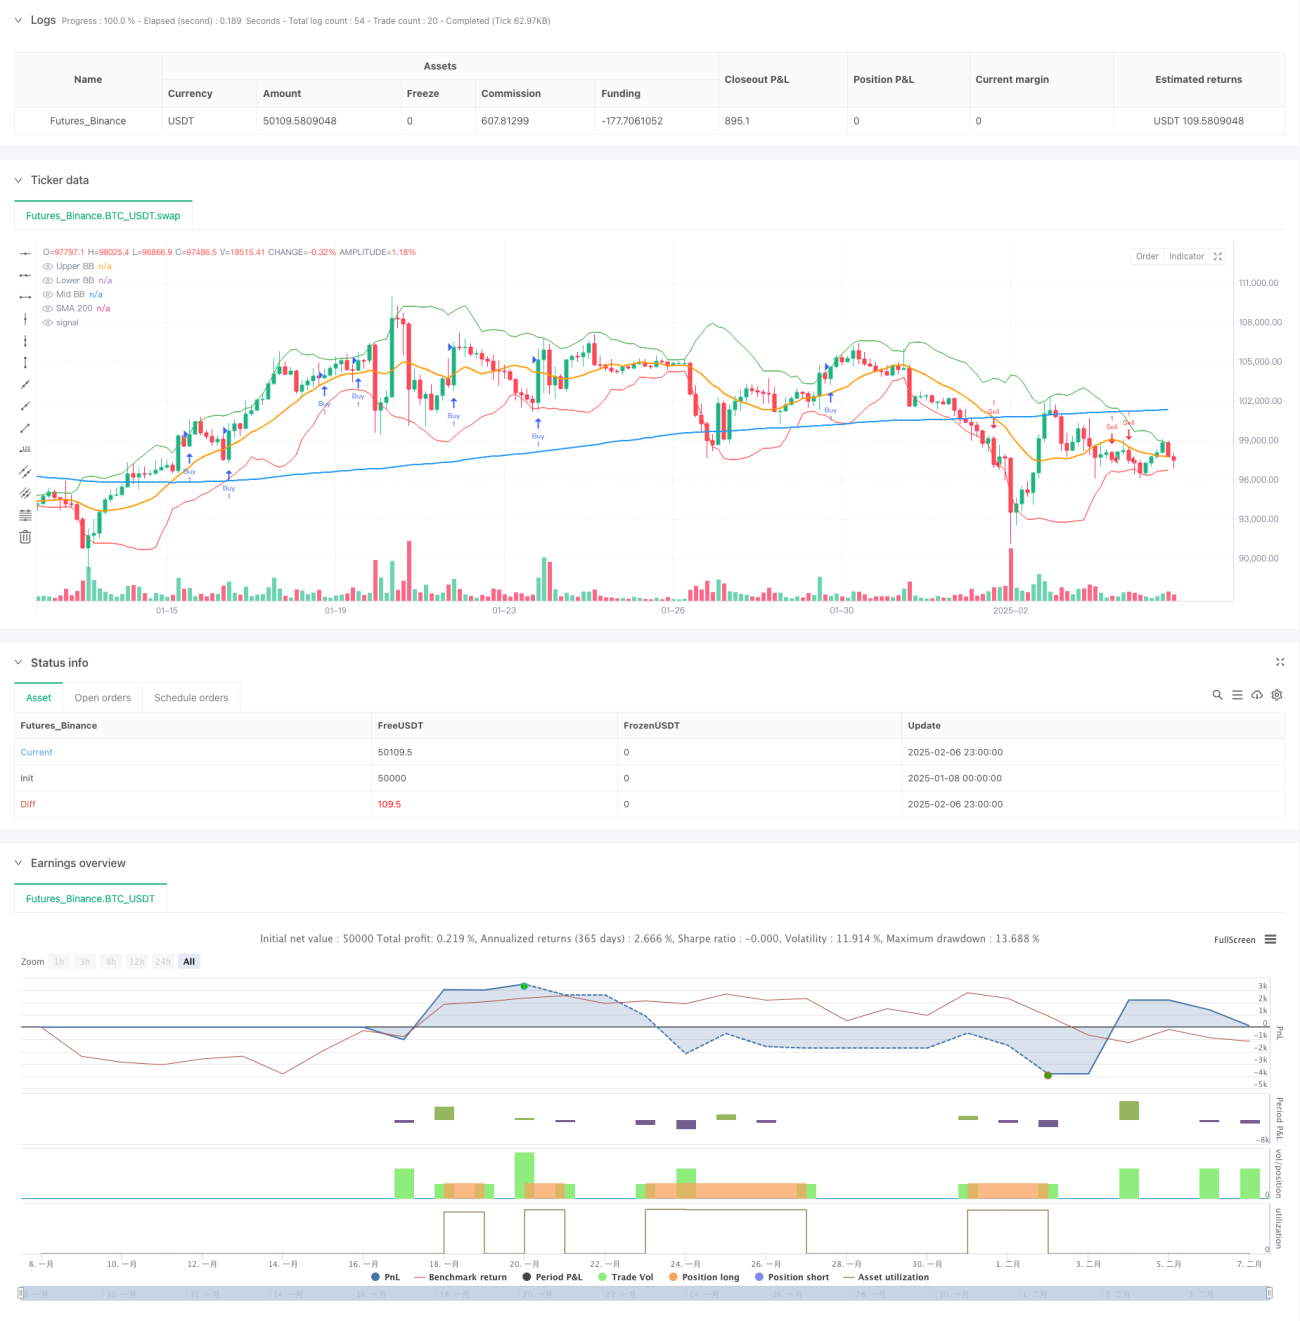
Overview
This strategy is a trend-following trading system that combines Moving Average (SMA), Bollinger Bands (BB), and candlestick patterns. It primarily identifies trading signals through engulfing patterns, confirmed by the 200-day moving average and Bollinger Bands middle line, while implementing a 1:2 risk-reward ratio for risk management.
Strategy Principles
The core logic relies on the combination of multiple technical indicators to confirm trading signals. Specifically:
- Uses 200-day SMA to determine the overall trend direction
- Employs Bollinger Bands middle line as secondary trend confirmation
- Identifies specific entry points through engulfing patterns
- Implements a fixed 1:2 risk-reward ratio for stop-loss and take-profit levels
The system enters long positions when bullish engulfing patterns appear above both the 200-day SMA and Bollinger Bands middle line. Conversely, it enters short positions when bearish engulfing patterns form below these levels.
Strategy Advantages
- Multiple technical indicators increase signal reliability
- Uses classic trend-following indicators that are easy to understand and implement
- Fixed risk-reward ratio promotes long-term profitable trading
- Clear entry and exit rules minimize subjective judgment
- Combines trend and momentum analysis for improved success rate
Strategy Risks
- May generate frequent false signals in ranging markets
- SMA and Bollinger Bands are lagging indicators, potentially missing opportunities
- Fixed risk-reward ratio might not suit all market conditions
- Stop-loss levels may be wide in highly volatile markets
- Requires a large sample size to demonstrate strategy effectiveness
Strategy Optimization
- Consider implementing dynamic risk-reward ratios based on market volatility
- Add volume indicators for additional confirmation
- Incorporate additional technical indicators to filter false signals
- Optimize entry timing through multi-timeframe signal coordination
- Introduce adaptive indicator parameters to improve strategy flexibility
Summary
This is a well-structured trend-following strategy with clear logic. The combination of moving averages, Bollinger Bands, and engulfing patterns ensures reliable trading signals while providing explicit risk management methods. Despite some inherent lag, it represents a highly operable trading system with controllable risk.
/*backtest
start: 2025-01-08 00:00:00
end: 2025-02-07 00:00:00
period: 3h
basePeriod: 3h
exchanges: [{"eid":"Futures_Binance","currency":"BTC_USDT"}]
*/

// This Pine Script™ code is subject to the terms of the Mozilla Public License 2.0 at https://mozilla.org/MPL/2.0/
// © ardhankurniawan

//@version=5- 1