
Ringkasan
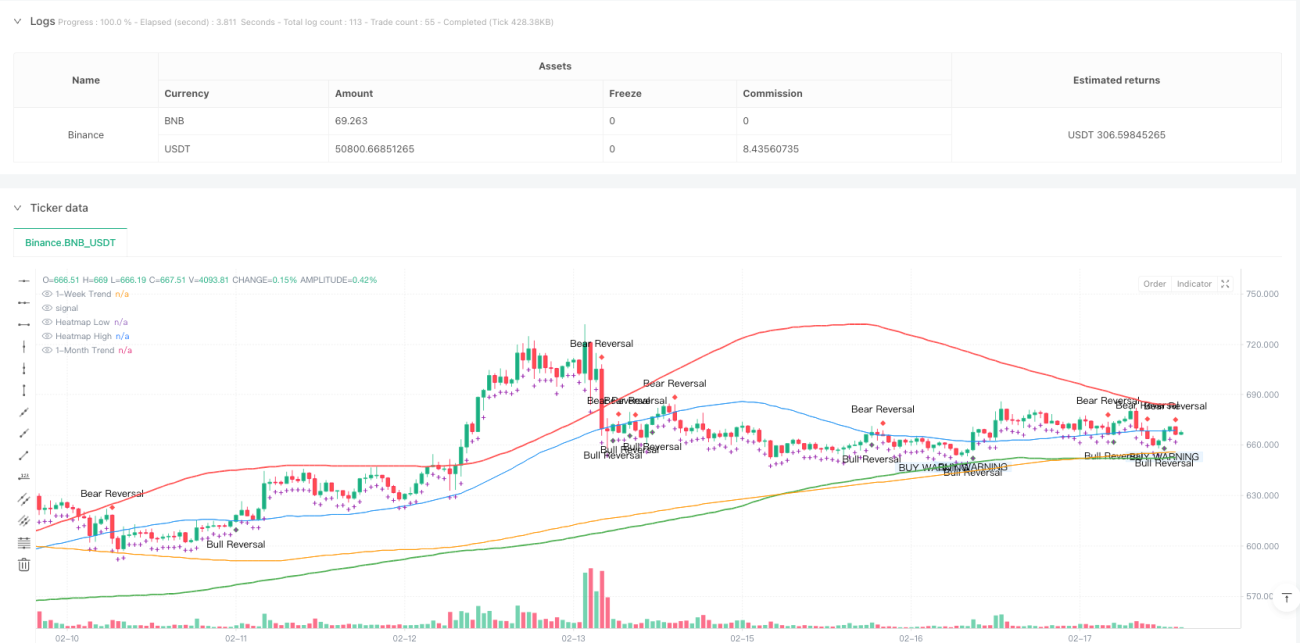
Ini adalah strategi perdagangan kuantitatif berfrekuensi tinggi yang didasarkan pada analisis tren hot chart dan multi-siklus. Strategi ini memungkinkan penarikan tepat waktu masuk ke pasar dengan menggabungkan area resistensi yang didukung oleh hot chart, rata-rata bergerak berkala dan bulanan, dan sistem sinyal peringatan. Inti dari strategi ini adalah mengidentifikasi area harga kunci melalui teknologi hot chart dan menggunakan konfirmasi tren multi-siklus untuk meningkatkan akurasi perdagangan.
Prinsip Strategi
Strategi ini didasarkan pada beberapa komponen utama:
- Hot chart trading area: Menggunakan harga tertinggi dan harga terendah yang bergerak rata-rata dihitung untuk mendukung titik resistensi, membentuk hot chart trading.
- Konfirmasi tren multi-siklus: Menggunakan garis lingkar dan garis bulan untuk menilai tren besar pasar.
- Sistem sinyal peringatan dini: memberikan peringatan dini sebelum sinyal perdagangan yang sebenarnya, membantu pedagang bersiap lebih awal.
- Trends Predict Trajectory: Menunjukkan arah pergerakan harga yang mungkin melalui tanda salib ungu.
- Indikator bullish/bearish reversal: menunjukkan titik balik tren potensial melalui tanda berbentuk berlian.
Keunggulan Strategis
- Analisis multi-dimensi: menggabungkan grafik panas, tren, dan sinyal reversal untuk memberikan wawasan pasar secara menyeluruh.
- Mekanisme peringatan dini: Memberikan peringatan dini melalui gelembung peringatan dini untuk menghindari keputusan terburu-buru.
- Adaptabilitas: dapat beroperasi dalam beberapa periode waktu, sesuai dengan gaya perdagangan yang berbeda.
- Efek visual: Sistem indikator visual yang jelas untuk membuat keputusan cepat.
- Pengendalian risiko: Mengurangi risiko sinyal palsu dengan mekanisme multiple confirmation.
Risiko Strategis
- Risiko pasar yang berfluktuasi: sinyal palsu dapat dihasilkan pada saat volatilitas tinggi.
- Sensitivitas parameter: Sensitivitas grafik panas dan pilihan periode rata-rata bergerak memiliki pengaruh besar terhadap kinerja strategi.
- Risiko slippage: perdagangan frekuensi tinggi mungkin menghadapi slippage yang lebih besar.
- Biaya Transaksi: Transaksi yang sering dapat menghasilkan biaya transaksi yang lebih tinggi.
- Ketergantungan pada kondisi pasar: Strategi mungkin tidak efektif dalam kondisi pasar tertentu.
Arah optimasi strategi
- Penyesuaian parameter dinamis: Sistem parameter adaptif diperkenalkan untuk menyesuaikan sensitivitas heatmap sesuai dengan fluktuasi pasar.
- Filter Sinyal: Meningkatkan jumlah lalu lintas dan tingkat fluktuasi filter, mengurangi sinyal palsu.
- Manajemen risiko: bergabung dengan sistem manajemen target stop loss dan profit yang dinamis.
- Identifikasi lingkungan pasar: Mengembangkan modul identifikasi lingkungan pasar untuk menghentikan perdagangan secara otomatis dalam lingkungan pasar yang tidak sesuai.
- Optimasi pembelajaran mesin: memperkenalkan algoritma pembelajaran mesin untuk mengoptimalkan pilihan parameter dan konfirmasi sinyal.
Meringkaskan
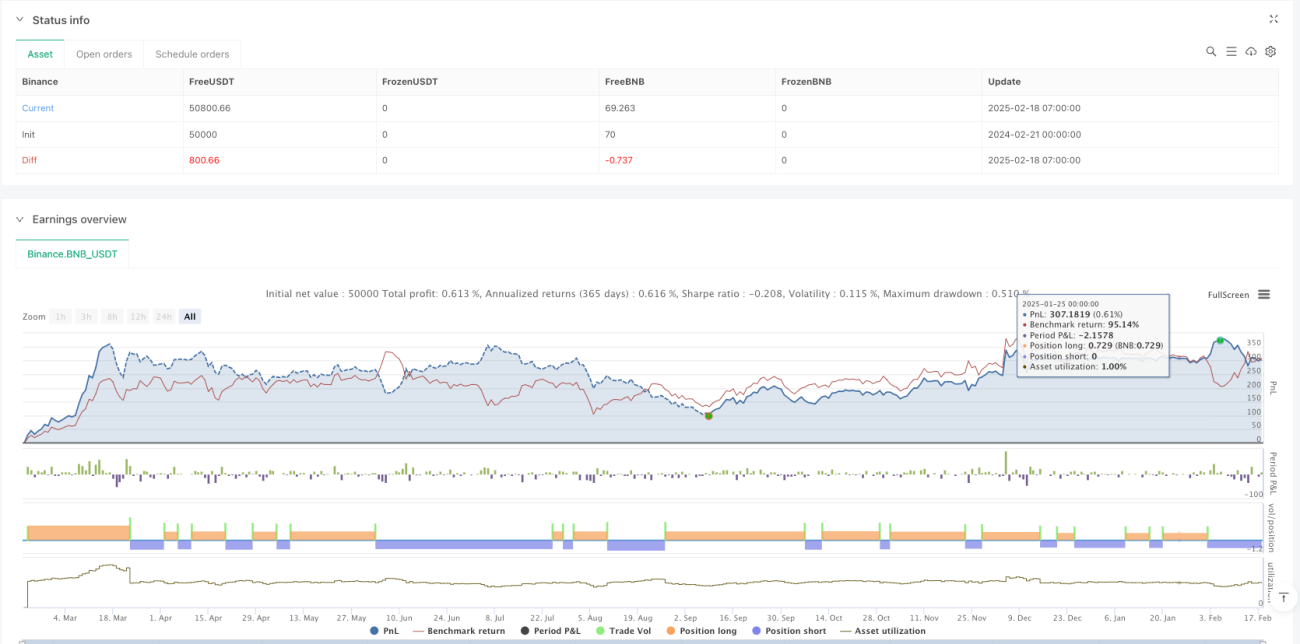
Strategi Sniper Hot Chart Multi-Cycle Berfrekuensi Tinggi adalah sistem perdagangan komprehensif yang menggabungkan berbagai indikator teknis. Dengan kombinasi analisis Hot Chart, pengakuan tren multi-siklus, dan mekanisme peringatan dini, ini memberikan para pedagang alat pendukung keputusan yang andal. Keberhasilan strategi bergantung pada pengaturan parameter yang benar dan pilihan lingkungan pasar, yang disarankan untuk melakukan pengembalian dan pengoptimalan yang memadai sebelum perdagangan langsung.
- 1