Strategi kuantitatif stop loss dinamis double cross EMA

2
Follow
480
Followers
Ringkasan
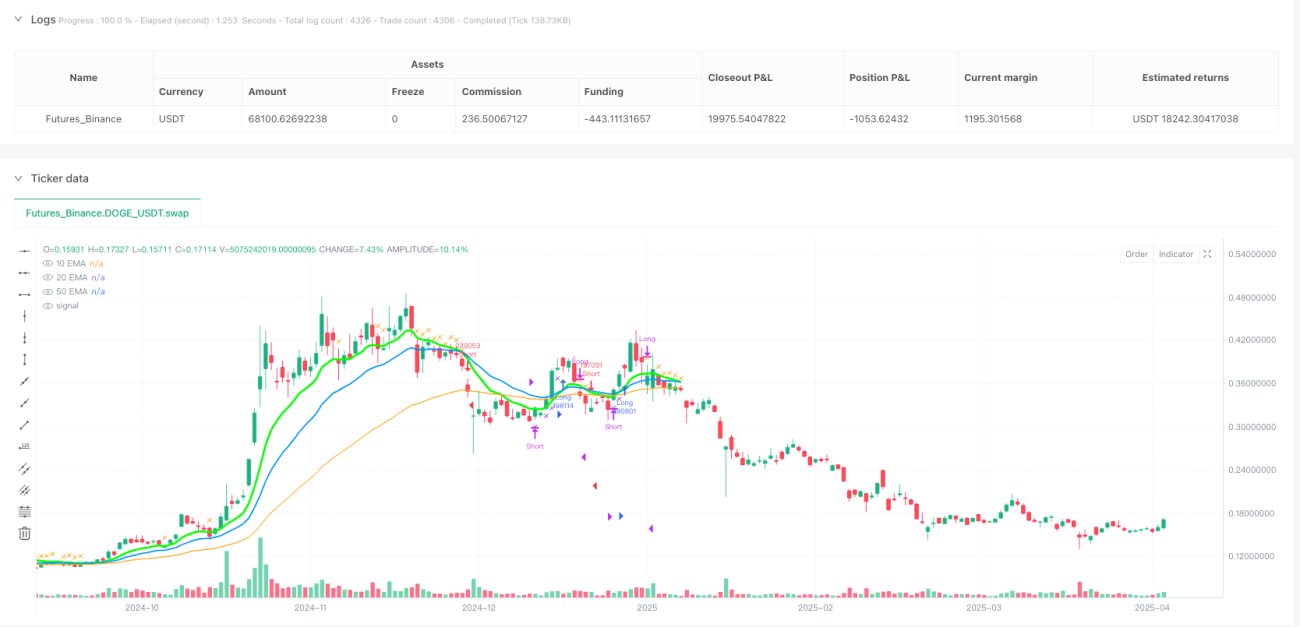
Strategi ini didasarkan pada prinsip ganda silang dari indeks moving average (EMA) yang digabungkan dengan desain mekanisme stop loss dinamis. Strategi ini menggunakan 10 hari EMA dan 20 hari EMA sebagai sinyal perdagangan utama, dan menggunakan 50 hari EMA sebagai filter tren, sementara 10 hari EMA sebagai garis stop loss dinamis.
Prinsip Strategi
- Penghakiman kondisional:
- Kondisi bullish: Bila EMA 10 hari melintasi EMA 20 hari dari bawah (Goldfork) dan harga close-out saat ini berada di atas EMA 50 hari, maka tren bullish dikonfirmasi.
- Kondisi overhead: Ketika 10 hari EMA dari atas melewati 20 hari EMA (dead-fork) dan saat ini harga close-out di bawah 50 hari EMA, konfirmasi tren overhead dibentuk.
- Mekanisme Stop Loss Dinamis:
- Pada periode multi-head, jika harga close out di bawah EMA 10 hari, stop loss akan dipicu.
- Selama posisi kosong, jika harga tutup melampaui EMA 10 hari, stop loss akan dipicu.
- Filter trenEMA 50 hari sebagai filter tren jangka panjang, menghindari perdagangan yang sering terjadi dalam situasi yang bergolak.
Analisis Keunggulan
- Kemampuan untuk melacak trenDouble EMA crossing efektif menangkap tren jangka menengah, 50 hari EMA filter mengurangi sinyal palsu.
- Manajemen risiko dinamisEMA 10 hari: EMA sebagai garis stop loss dinamis, dapat disesuaikan dengan tren untuk keluar dari titik, melindungi keuntungan.
- Desain visual: Membedakan tiga EMA dengan warna dan lebar garis yang berbeda, dan menandai sinyal jual beli, untuk pemantauan langsung.
- Parameter yang dapat disesuaikan: Siklus EMA dapat disesuaikan secara fleksibel dengan parameter input untuk menyesuaikan dengan fluktuasi pasar yang berbeda.
Analisis risiko
- Risiko keterlambatanEMA memperkirakan penurunan yang lebih besar dapat terjadi dalam situasi yang berubah dengan cepat.
- SolusiFilter extreme fluctuation: gabungan indikator momentum (seperti RSI)
- Kerugian pasar yang bergolakDalam situasi tanpa tren, sinyal silang dapat sering memicu transaksi yang tidak valid.
- Solusi: memperkenalkan indikator volatilitas (seperti ATR) untuk menghentikan perdagangan.
- Parameter tidak cocokPeriode EMA tetap mungkin tidak sesuai dengan semua kondisi pasar.
- SolusiValidasi menggunakan algoritma siklus adaptif atau multi-frame timeframe.
Arah optimasi
- Penguatan sinyal komposit:
- Peningkatan konfirmasi lalu lintas (misalnya, amplifikasi saat terobosan), meningkatkan keandalan sinyal.
- Manajemen Posisi Dinamis:
- Mengubah ukuran posisi berdasarkan volatilitas (ATR) untuk mengurangi eksposur pada periode berisiko tinggi.
- Optimalisasi Pembelajaran Mesin:
- Menggunakan model pelatihan data historis untuk mengoptimalkan secara dinamis portofolio siklus EMA.
- Verifikasi multi-frame:
- Memerlukan arah EMA pada tingkat garis lingkar yang konsisten dengan sinyal garis matahari, meningkatkan tingkat kemenangan.
Meringkaskan
Strategi ini mencapai keseimbangan antara pelacakan tren dan pengendalian risiko melalui kombinasi EMA double-cross dan stop loss dinamis. Keunggulan utamanya adalah struktur logis yang jelas dan desain visual yang intuitif, yang cocok untuk skenario perdagangan frekuensi rendah dan menengah.
Source
Pine
Strategy parameters
Related strategies
Comment
All comments (0)
No data
- 1