EMA inFusion Pro Strategi Fusion Data Multi-Sumber

🎯 Inti Keunggulan Strategi: Bukan Sekadar Strategi EMA yang Melihat Harga
Tahukah Anda? Kebanyakan orang hanya menggunakan EMA untuk melihat harga, tetapi apa kehebatan strategi ini? Ia dapat menghitung EMA dari 6 sumber data yang berbeda! Ibarat memasak tidak hanya menggunakan garam untuk membumbui, tetapi juga gula, cuka, kecap, yang memberi Anda sinyal trading yang lebih kaya.
Catat! Ke-6 sumber data ini meliputi: harga biasa, volume, laju perubahan, harga rata-rata K-line, volume rata-rata K-line, laju perubahan rata-rata K-line. Masing-masing memiliki wawasan pasar yang berbeda!
📊 Sistem Filter Tiga Lapis: Membuat Sinyal Lebih Akurat
Strategi ini tidak memberikan sinyal sembarangan! Ia memiliki tiga "pemeriksaan keamanan":
Pertama: Penentuan Tren EMA 📈
Seperti melihat ramalan cuaca, tentukan dulu arah besar apakah cerah atau hujan
Kedua: Filter Kekuatan ADX 💪
ADX seperti alat pengukur kekuatan angin, hanya ketika tren cukup kuat (default di atas 25), barulah sinyal dikeluarkan. Hindari terjebak dalam pasar yang bergerak sideways!
Ketiga: Konfirmasi Volume 🔊
Peningkatan volume tiba-tiba seperti saham yang "berbicara dengan keras", membuktikan bahwa sinyal ini serius, bukan main-main
🎮 Tiga Mode Keluar: Sesuai dengan Gaya Trading yang Berbeda
Yang paling menarik, strategi ini memberikan 3 cara keluar, seperti game yang memiliki tiga tingkat kesulitan: mudah, normal, sulit:
Mode 1: Keluar dengan Sinyal Berlawanan 🔄
Paling sederhana dan kasar, ketika sinyal bullish muncul, tutup posisi short dan buka long; ketika sinyal bearish muncul, tutup posisi long dan buka short
Mode 2: Take Profit dan Stop Loss Dinamis ATR 📏
Menyesuaikan secara otomatis berdasarkan volatilitas pasar, ketika volatilitas besar, stop loss diperlonggar, ketika volatilitas kecil, diperketat
Mode 3: Take Profit dan Stop Loss Persentase Tetap 📊
Paling mudah dipahami, ambil untung 2%, rugi 1,5% (dapat disesuaikan)
🚀 Saran Aplikasi Praktis
Periode yang Cocok: Trading jangka menengah-pendek, sangat cocok untuk pasar dengan volatilitas tertentu
Panduan Menghindari Jebakan: Hati-hati di pasar sideways, disarankan mengaktifkan filter ADX
Cara Bermain Tingkat Lanjut: Dapat mencoba sumber data yang berbeda, sumber volume sangat efektif saat breakout dengan volume besar!
Keunggulan terbesar dari strategi ini adalah fleksibilitasnya yang kuat, Anda dapat memilih sumber data dan mode keluar yang paling sesuai berdasarkan kondisi pasar yang berbeda. Ingat, tidak ada strategi yang sempurna, hanya strategi yang paling cocok untuk pasar saat ini!
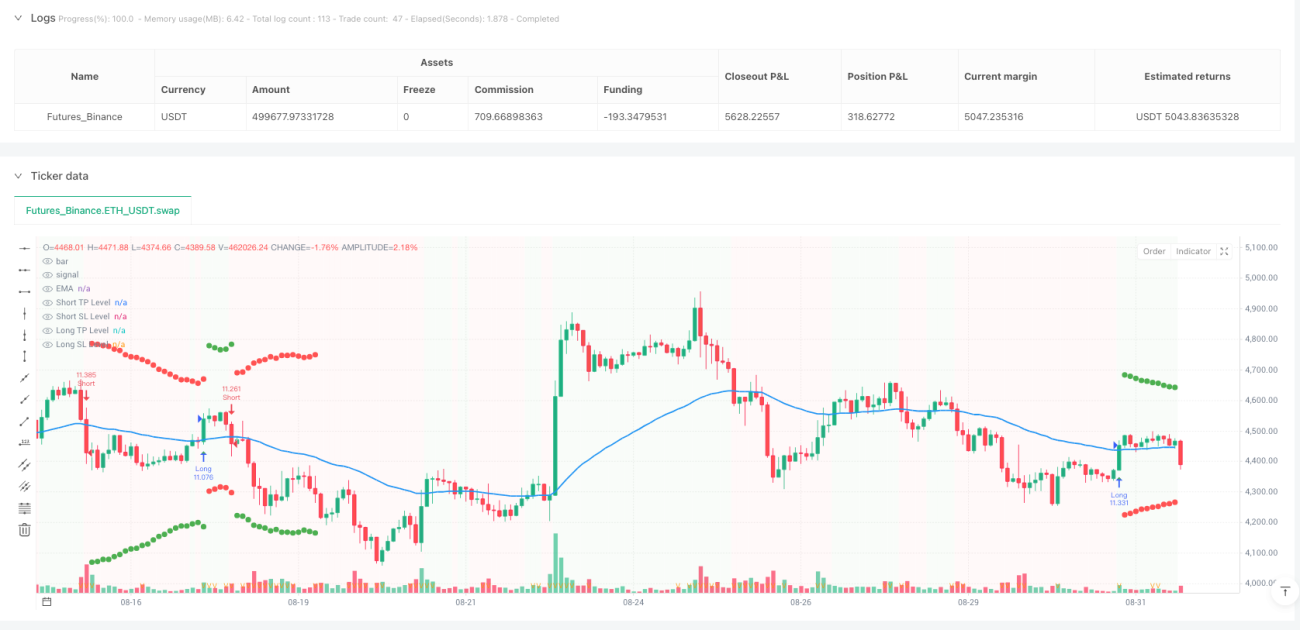
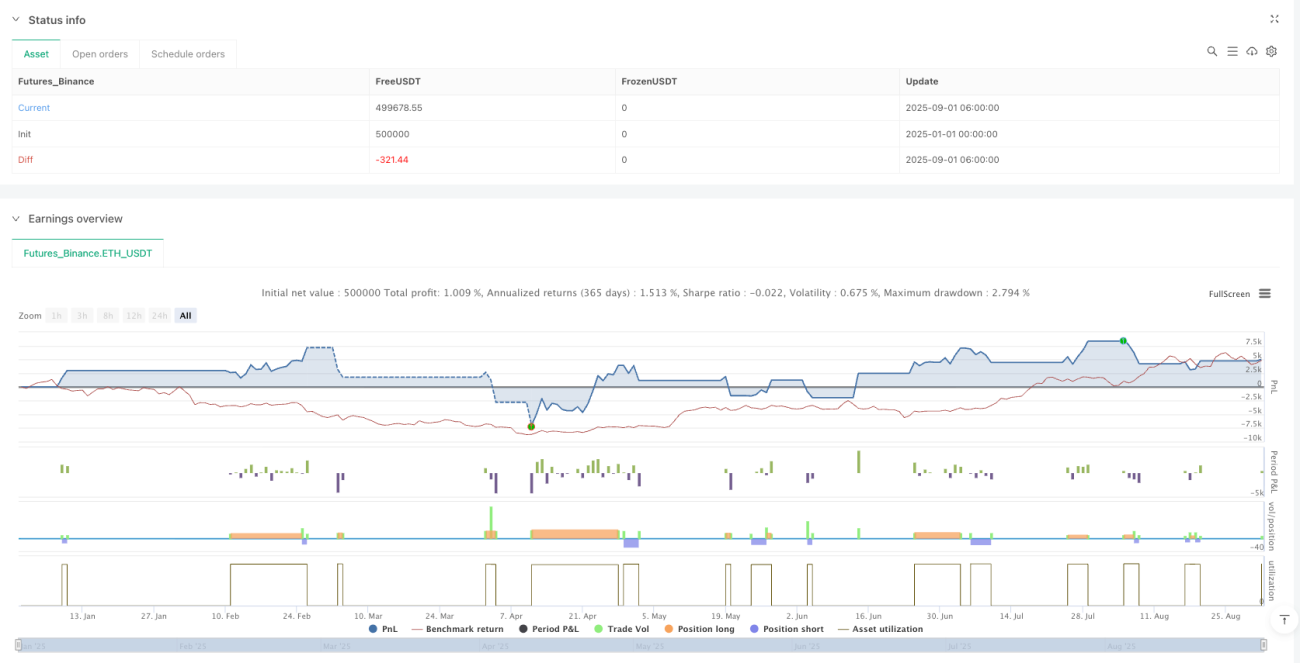
/*backtest
start: 2025-01-01 00:00:00
end: 2025-09-01 08:00:00
period: 2h
basePeriod: 2h
exchanges: [{"eid":"Futures_Binance","currency":"ETH_USDT","balance":500000}]
*/

//@version=5
//@fenyesk
strategy("EMA inFusion Pro - Source Selection", overlay=true, initial_capital=10000, default_qty_type=strategy.percent_of_equity, default_qty_value=10)
- 1