Strategi Pengganda Parameter: Metronom Pasar dengan Integrasi Multi-Indikator

🎯 Strategi Ajaib Apa Ini?
Tahukah Anda? Strategi ini seperti memasang "radar super" pada pasar! Tidak hanya melihat satu atau dua indikator secara sederhana, tetapi menggabungkan 9 indikator teknis yang berbeda seperti sebuah orkestra, di mana setiap indikator adalah "alat musik", dan hanya ketika mereka memainkan "nada" yang harmonis, strategi akan menghasilkan sinyal trading. Bayangkan ini seperti memiliki 9 ahli yang memberi saran di telinga Anda secara bersamaan, dan Anda hanya bertindak ketika mayoritas setuju!
📊 Pengungkapan Prinsip Inti
Perhatikan! Inti dari strategi ini terletak pada konsep "pengali parameter". Indikator-indikator seperti RSI, ADX, Momentum, Rate of Change, ATR, Volume, Acceleration, dan Slope terlebih dahulu dinormalisasi ke skala yang sama, kemudian dikalikan untuk menghasilkan "nilai kekuatan komprehensif". Seperti memasak, setiap bumbu memiliki proporsi optimal; strategi ini membantu Anda menemukan campuran sempurna dari berbagai "bumbu" pasar! Ketika nilai kekuatan komprehensif melintasi rata-ratanya, itulah waktu terbaik untuk masuk.
🔧 Alat Trading yang Dapat Disesuaikan
Apa bagian paling keren dari strategi ini? Anda dapat mengkombinasikannya secara bebas seperti menyusun balok! Tidak ingin menggunakan suatu indikator? Matikan saja. Ingin mengubah parameter periode? Terserah Anda. Bahkan ada filter tren SMA untuk membantu Anda menghindari jebakan trading melawan tren. Ini seperti "paket alat DIY strategi trading" yang memungkinkan Anda menyesuaikan konfigurasi berdasarkan kondisi pasar yang berbeda.
⚡ Panduan Aplikasi Praktis
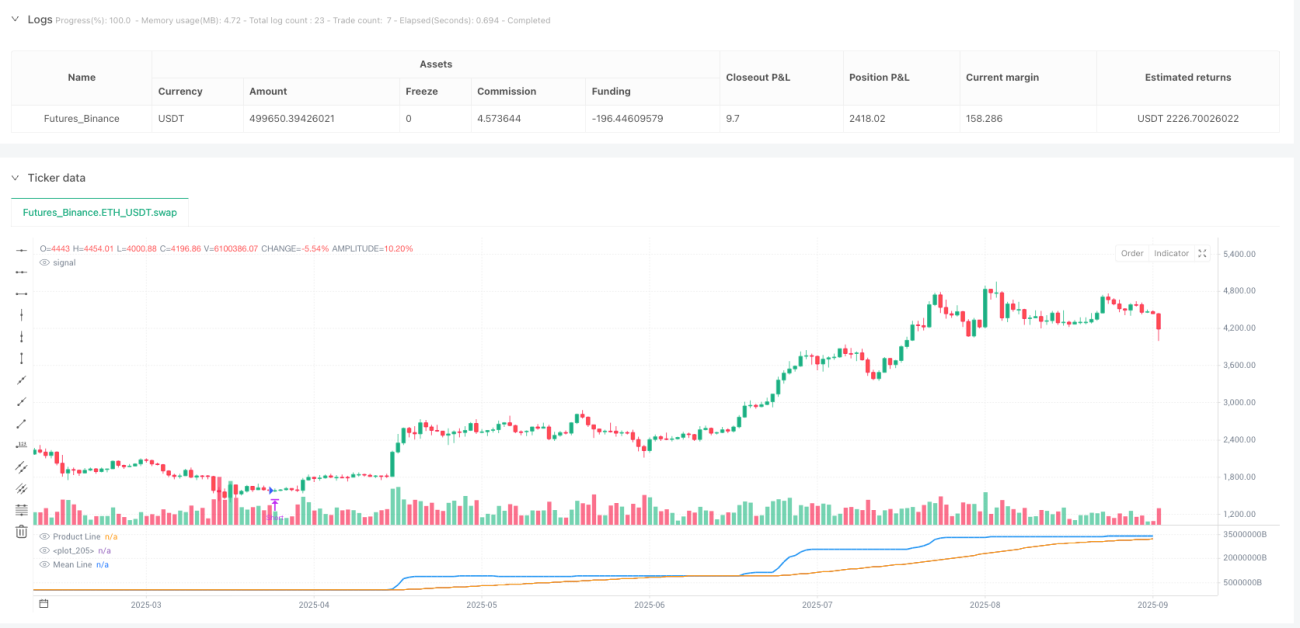
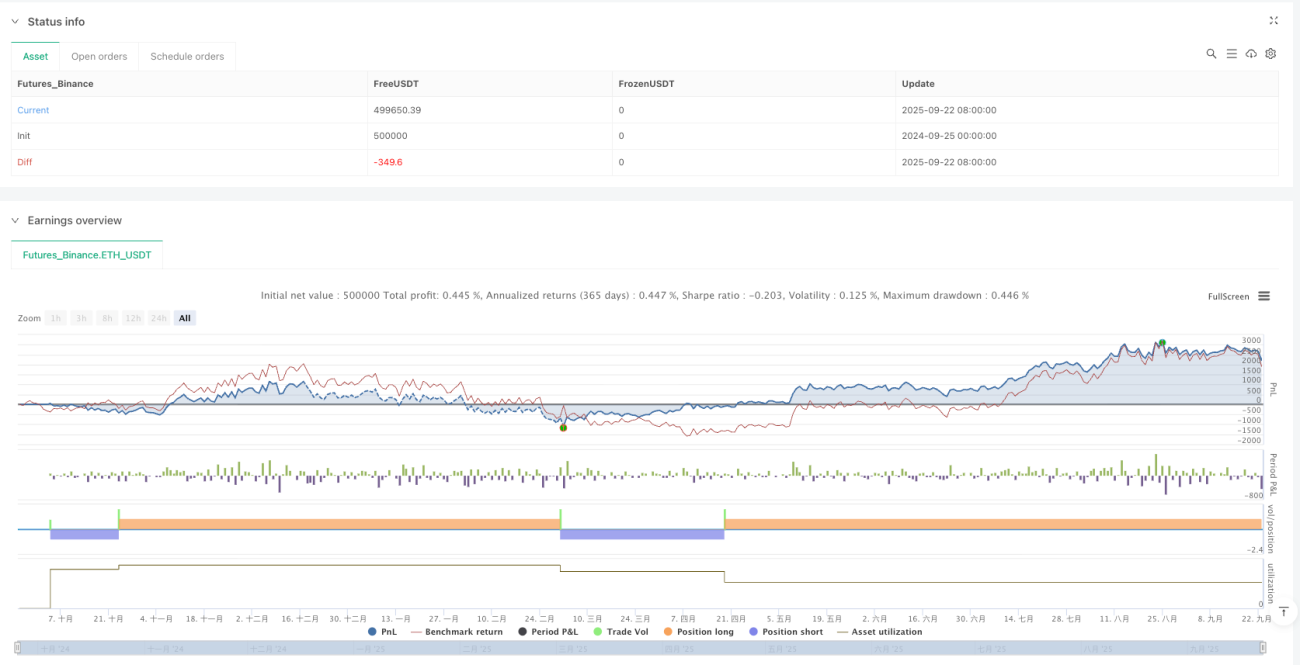
Panduan menghindari jebakan! Strategi ini sangat cocok untuk lingkungan pasar yang campuran antara sideway dan tren. Ketika garis produk biru melintasi ke atas garis rata-rata oranye, lakukan long; ketika melintasi ke bawah, lakukan short. Strategi ini juga dilengkapi dengan mekanisme penutupan posisi otomatis yang membantu, sehingga Anda tidak tetap memegang posisi bodoh saat sinyal terbalik muncul. Ingat, mengaktifkan filter tren memungkinkan Anda bermanuver dengan lancar dalam tren besar, sedangkan menonaktifkannya menangkap lebih banyak peluang jangka pendek!
//@version=5
strategy("Parametric Multiplier Backtester", shorttitle="PMB", overlay=false)

// Author: Script_Algo
// License: MIT
// Permission is hereby granted, free of charge, to any person obtaining a copy
// of this software and associated documentation files (the "Software"), to deal
// in the Software without restriction, including without limitation the rights
// to use, copy, modify, merge, publish, distribute, sublicense, and/or sell
// copies of the Software, subject to the following conditions:
// The above copyright notice and this permission notice shall be included in
// all copies or substantial portions of the Software.- 1