3.3 M言語での戦略の実施方法
作者: リン・ハーン優しさ, 作成日:2019-06-25 12:08:47, 更新日:2023-11-11 17:01:30
M言語での戦略の実施方法
概要
M言語,基本文法,モデル実行方法,モデル分類の導入の側面から,取引戦略を実現する前提を説明しました. この記事では,一般的に使用される戦略モジュールと技術から,前の部分を継続します. インディケーター,実行可能な日中の定量取引戦略を達成するのに役立つステップ・バイ・ステップ.
戦略モジュール

レゴのパーツでロボットをどのように作るのか考えてみてください.上から下,下から上まで,ピースごとに組み立てることは常にできません.少しの常識を持つ人は,頭,腕,足,翼,などをつなぎ合わせ,それらを完全なロボットに組み合わせるべきだと知っています.同じことがプログラムを書くこと,必要な機能を単一の戦略モジュールに書き,そしてこれらの個々の戦略モジュールを完全な取引戦略に組み合わせることにも当てはまります.下記では,一般的な戦略モジュールをいくつかリストします:
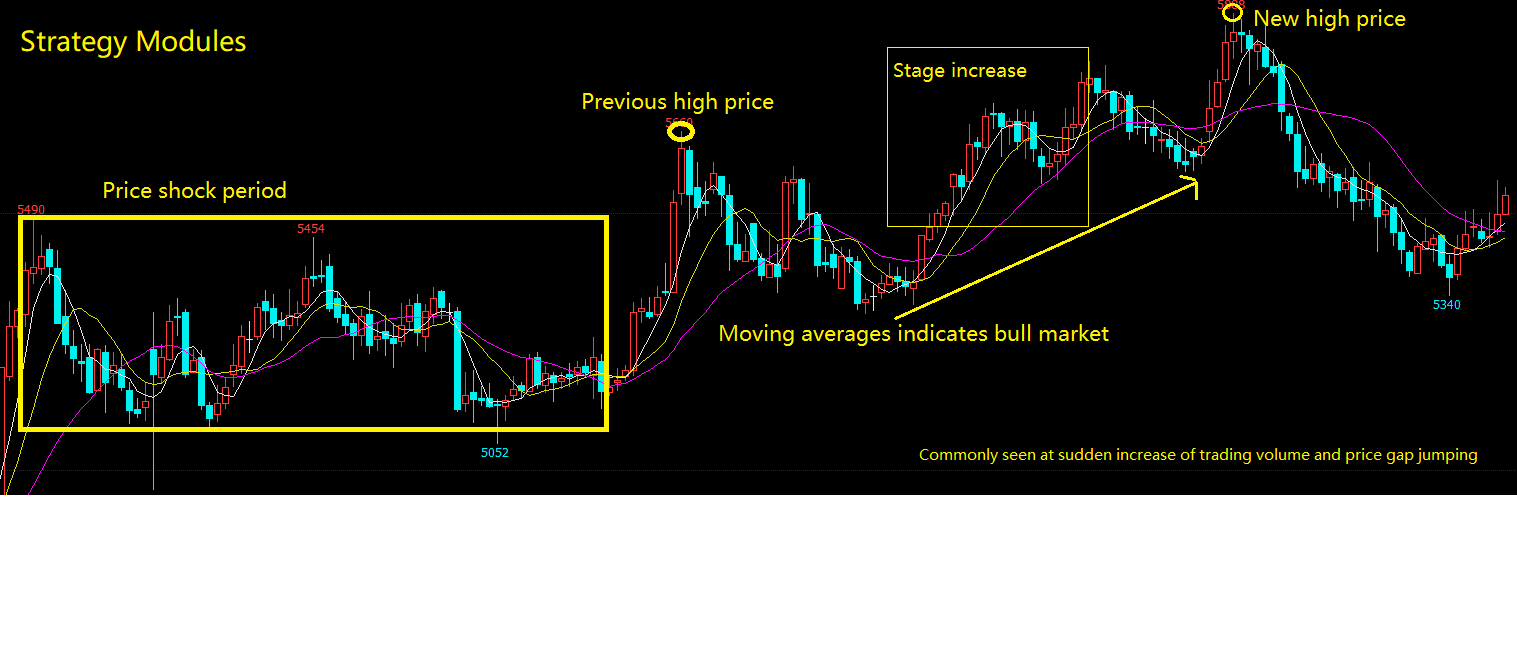
段階 的 な 増加
ステージ増加は,現在のK線
CLOSE_0:=CLOSE; //get the current K-line's closing price, and save the results to variable CLOSE_0.
CLOSE_10:=REF(CLOSE,10); //get the pervious 10 K-lines' closing price, and save the results to variable CLOSE_10

(CLOSE_0-CLOSE_10)/CLOSE_10*100;//calculating the percentage of current K line's closing price compare with previous N periods of closing price's difference.
新しい高価格
新しい高値は,現在のK線がNサイクル
HHV_10:=HHV(HIGH,10); //Get the highest price of latest 10 K-lines, which includes the current K-line.
HIGH>REF(HHV_10,1); //Judge whether the current K-line's highest price is greater than pervious K-lines' HHV_10 value.
価格上昇と大量取引量の増加
例えば,現在のKラインの閉じる価格が前10Kラインの閉じる価格の1.5倍である場合,10日間で価格が50%上昇し,取引量は前10Kラインの5倍以上増加した場合,次のように書ける.
CLOSE_10:=REF(CLOSE,10); //get the 10th K-line closing price
IS_CLOSE:=CLOSE/CLOSE_10>1.5; //Judging whether the current K Line closing price is 1.5 times greater than the value of CLOSE_10

VOL_MA_10:=MA(VOL,10); //get the latest 10 K-lines' average trading volume
IS_VOL:=VOL>VOL_MA_10*5; //Judging whether the current K-line's trading volume is 5 times greater than the value of VOL_MA_10

IS_CLOSE AND IS_VOL; //Judging whether the condition of IS_CLOSE and IS_VOL are both true.
狭い価格ショック市場
狭いショック市場とは,価格が最近の期間で一定の範囲内で維持されていることを意味します.例えば,10サイクルにおける最高価格を10サイクルにおける最低価格をマイナスすると,現在のK線
HHV_10:=HHV(CLOSE,10); //Get the highest price in 10 cycles(including current K-line)
LLV_10:=LLV(CLOSE,10); //Get the lowest price in 10 cycles(including current K-line)

(HHV_10-LLV_10)/CLOSE<0.05; //Judging whether the difference between HHV_10 and LLV_10 divided by current k-line's closing price is less than 0.05.
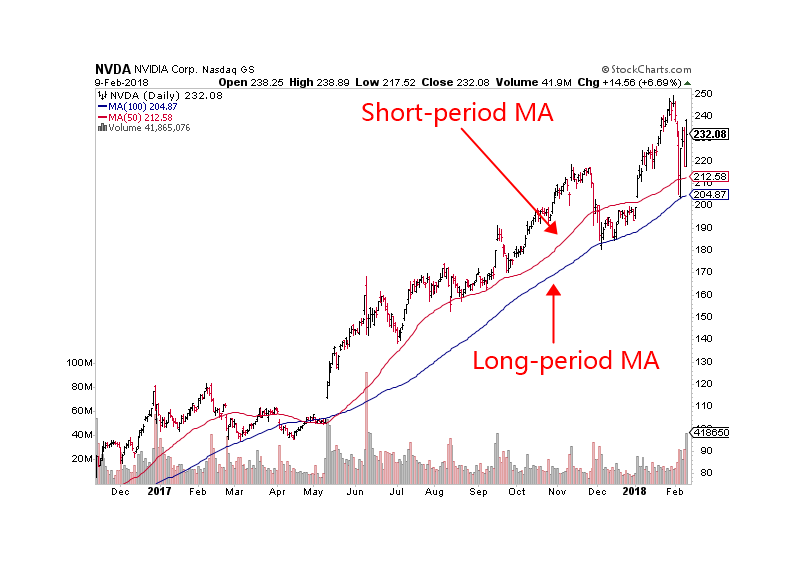
移動平均は牛市を示しています
移動平均線は長距離と短距離の方向を示し,K線は5,10,20,30,60移動平均線によって支えられ,または抵抗され,移動平均線は牛市場または熊市場を示します.
MA_5:=MA(CLOSE,5);  //get the moving average of 5 cycle closing price.
MA_10:=MA(CLOSE,10);//get the moving average of 10 cycle closing price.
MA_20:=MA(CLOSE,20);//get the moving average of 20 cycle closing price.
MA_30:=MA(CLOSE,30);//get the moving average of 30 cycle closing price.

MA_5>MA_10 AND MA_10>MA_20 AND MA_20>MA_30; //determine wether the MA_5 is greater than MA_10, and MA_10 is greater than MA_20, and MA_20 is greater than MA_30.
過去の高価格とその場所
前回の高値とその位置の位置を取得するには,直接 FMZ Quant API を使用できます.
HHV_20:=HHV(HIGH,20); //get the highest price of 20 cycle(including current K line)
HHVBARS_20:=HHVBARS(HIGH,20); //get the number of cycles from the highest price in 20 cycles to current K line
HHV_60_40:REF(HHV_20,40); //get the highest price between 60 cycles and 40 cycles.
価格格差の上昇
価格格差は,K線の最高値と最低値が接続されていない場合である.それは2つのK線で構成され,価格格差は将来の価格動きにおけるサポートとプレッシャーポイントの基準価格である.価格格差が発生すると,元の方向のトレンドに沿った加速が始まると仮定することができる.
HHV_1:=REF(H,1); //get the pervious K line's highest price
LLV_1:=REF(L,1); //get the pervious K line's lowest price
HH:=L>HHV_1; //judging wether the current K line's lowest price is greater than pervious K line's highest price (jump up)
LL:=H<LLV_1; //judging wether the current K line's highest price is greater than pervious K line's lowest price (jump down)
HHH:=L/REF(H,1)>1.001; //adding additional condition, the bigger of the price gap, the stronger the signal (jump up)
LLL:=H/REF(L.1)<0.999; //adding additional condition, the bigger of the price gap, the stronger the signal (jump down)
JUMP_UP:HH AND HHH; //judging the overall condition, whether it is a jump up
JUMP_DOWN:LL AND LLL; //judging the overall condition, whether it is a jump down
共通技術指標
移動平均
移動平均は,動向価格軌跡である日々の価格の算術平均である.移動平均システムは,ほとんどのアナリストが使用する一般的な技術ツールである.技術的観点から,それは技術アナリストの心理的な価格に影響を与える要因である.思考取引の意思決定要因は,技術アナリストのための良い参照ツールである. FMZ Quantツールは,以下の通り,さまざまな種類の移動平均をサポートする.
MA_DEMO:MA(CLOSE,5);   // get the moving average of 5 cycle
MA_DEMO:EMA(CLOSE,15); // get the smooth moving average of 15 cycle
MA_DEMO:EMA2(CLOSE,10);// get the linear weighted moving average of 10 cycle
MA_DEMO:EMAWH(CLOSE,50); // get the exponentially weighted moving average of 50 cycle
MA_DEMO:DMA(CLOSE,100);  // get the dynamic moving average of 100 cycle
MA_DEMO:SMA(CLOSE,10,3); // get the fixed weight of 3 moving average of closing price in 10 cycle
MA_DEMO:ADMA(CLOSE,9,2,30); // get the fast-line 2 and slow-line 30 Kaufman moving average of closing price in 9 cycle.
ボリンジャー・バンド
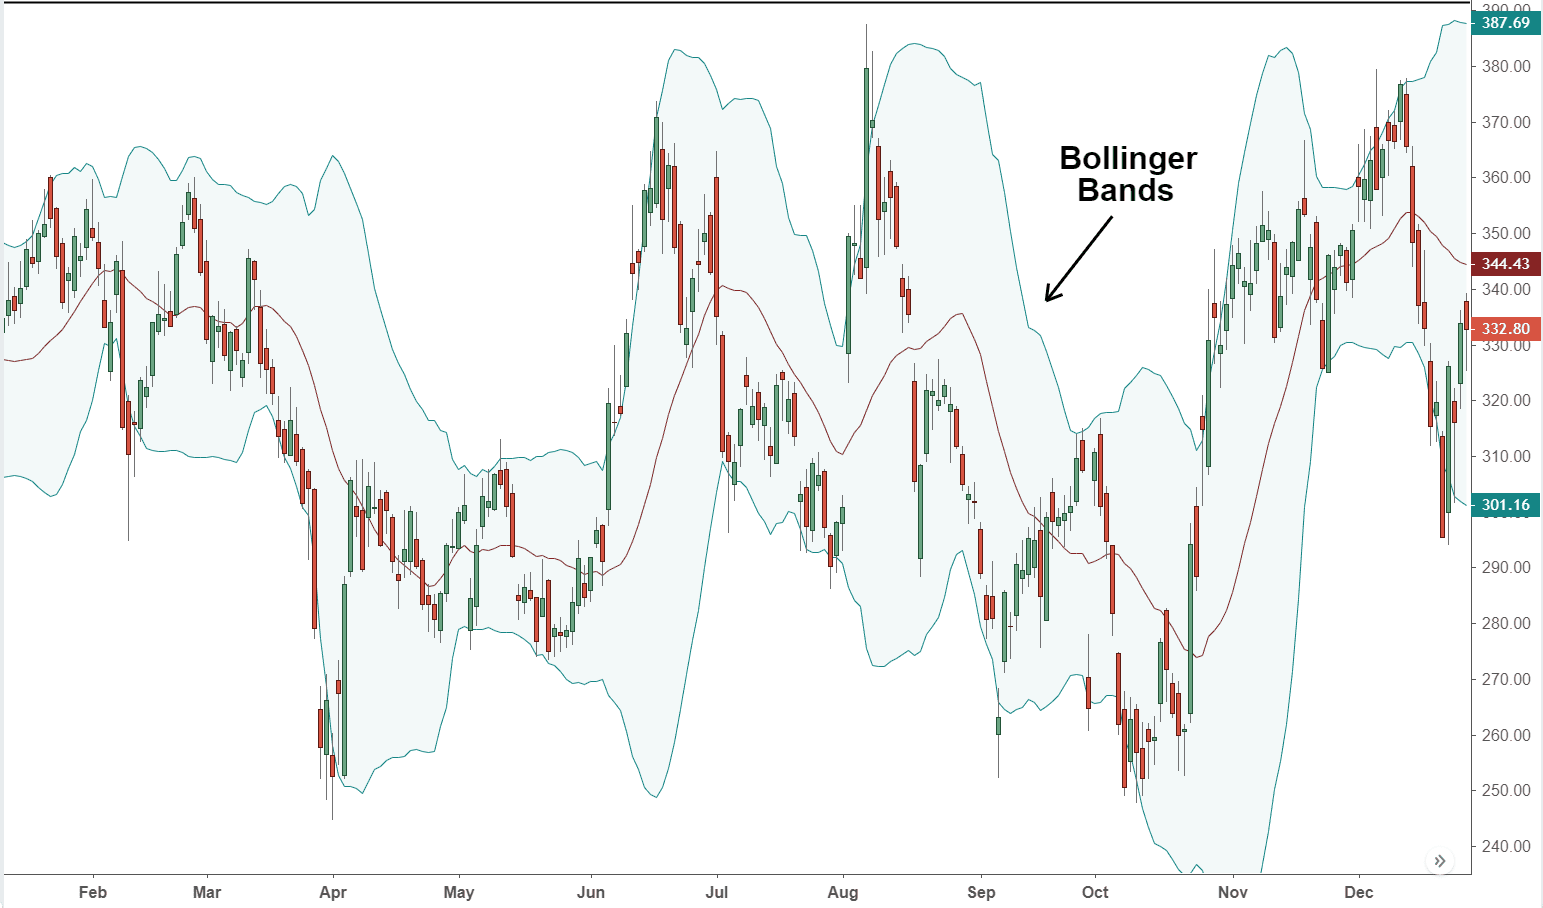
ボリンガー帯も統計原理に基づいている. 中間レールはN日移動平均値に基づいて計算され,上下レールは標準偏差値に基づいて計算される. BOLLチャネルが幅から狭く変化し始めると,価格は徐々に平均値に戻る. BOLLチャネルが狭いから幅に変化すると,市場は変化し始めることを意味します.価格が上線線を横切ると,購買力が向上することを意味します.価格が下線を横切ると,販売力が向上することを意味します.
すべての技術指標の中で,ボリンガー帯の計算方法は最も複雑で,中央軌跡 (MB),上方軌跡 (UP),下方軌跡 (DN) を含む統計学における標準偏差の概念を導入しています. 幸いなことに,計算の詳細を知らなくても,以下のようにFMZ Quantプラットフォームで直接使用できます:
MID:MA(CLOSE,100); //calculating moving average of 100 cycle, call it Bollinger Bands middle trajectory
TMP2:=STD(CLOSE,100); //calculating standard deviation of closing price of 100 cycle.
TOP:MID+2*TMP2; //calculating middle trajectory plus 2 times of standard deviation, call it upper trajectory
BOTTOM:MID-2*TMP2; //calculating middle trajectory plus 2 times of standard deviation, call it lower trajectory
MACD インディケーター
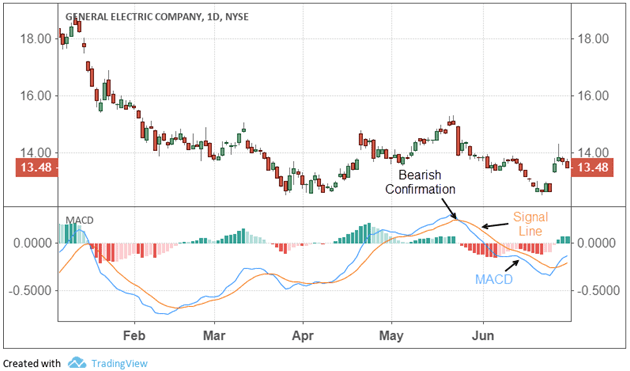
MACD指標は,高速 (短期) および遅い (長期) 移動平均値およびそれらの総和および分離を用いた二重スムーズ化操作である.移動平均値の原則に従って開発されたMACDは,移動平均値が頻繁に誤った信号を発する欠陥をなくし,他の良い側面の効果も保持する.したがって,MACD指標は移動平均値の傾向と安定性を持っています.それは株式の買取販売のタイミングを研究するために使用され,株式価格の変化を予測します.あなたは次のように使用することができます:
DIFF:EMA(CLOSE,10)-EMA(CLOSE,50); //First calculating the difference between short-term moving average and long-term moving average.
DEA:EMA(DIFF,10); //Then calculating average of the difference.
上記は,定量的な取引戦略の開発で一般的に使用される戦略モジュールです. さらに,それ以上のものがあります. 上記のモジュール例を通じて,主観的な取引で最も頻繁に使用するいくつかの取引モジュールを実装することもできます. 方法は同じです. 次に,実行可能な日中取引戦略を書くことを始めました.
戦略書き方
フォレックススポット市場で,HANS123と呼ばれる有名な戦略があります. その論理は,基本的に市場開通後,K行の数の最高または最低価格を通過するかどうかを判断しています.
戦略の論理
-
オープンしてから30分後に市場に入れる準備ができています
-
上部レール = 開封後30分
-
下のレール = 開封後30分
-
価格が上限を超えると,買い出し,ポジションを開きます.
-
価格が下のレールを下回ると 売り手はポジションを開きます
-
日中の取引戦略,閉店前に閉店
戦略コード
// Data Calculation
Q:=BARSLAST(DATA<>REF(DATA,1))+1; //Calculating the number of period from
the first K line of the current trading day to current k line, and assign the results to N
HH:=VALUEWHEN(TIME=0930,HHV(H,Q)); //when time is 9:30, get the highest price of N cycles, and assign the results to HH
LL:=VALUEWHEN(TIME=0930,LLV(L,Q)); //When time is 9:30, get the lowest price of N cycles, and assign the results to LL

//Placing Orders
TIME>0930 AND TIME<1445 AND C>HH,BK; //If the time is greater than 9:30 and lesser than 14:45, and the closing price is greater than HH, opening long position.
TIME>0930 AND TIME<1445 AND C<LL,SK; //If the time is greater than 9:30 and lesser than 14:45, and the closing price is lesser than LL, opening short position.
TIME>=1445,CLOSEOUT; //If the time is greater or equal to 14:45, close all position.

//Filtering the signals
AUTOFILTER;  //opening the filtering the signals mechanism
結論から言うと
上記では,戦略モジュールの概念を学びました.よく使われるいくつかの戦略モジュールのケースを通じて,我々はFMZ Quantプログラミングツールの一般的なアイデアを持っていた. 戦略モジュールを書き,プログラミング論理思考を改善することを学ぶことは,高度な定量的な取引の重要なステップです. 最後に,我々は FMZ Quantツールを使用して,クラシックフォレックス取引戦略に従って取引戦略を実装しました.
次のセクションの通知
FMZ Quantプラットフォームでは,初心者向けにさらに簡単なプログラミングツールがあります.それは視覚プログラミングです.すぐに学ぼう!
放課後 運動
-
主観的な取引で最も頻繁に使用するいくつかの取引モジュールを実装してみてください.
-
FMZ Quant プラットフォームで M 言語を使用して KDJ インデックス アルゴリズムを実装してみましょう.