
KLineChart関数を使用して戦略図の設計を容易にする
戦略を設計する際に、JavaScript や Python を使用して戦略を記述するときに、戦略チャートの表示を設計する必要があることがよくあります。プログラミングや FMZ プラットフォームで使用されるチャート ライブラリに精通していないユーザーは、カスタム チャートを描画するためのコード設計に苦労することがよくあります。では、少量のコードを書くだけで、内容の充実した戦略チャートを描くにはどうすればよいのでしょうか?
このシンプルでありながら強力な描画方法は、豊富な描画機能で有名な Pine 言語に見られます。 Pine 言語の描画インターフェースを JavaScript および Python 言語のストラテジーに接続できれば、開発者がストラテジーの描画機能を設計するのが非常に容易になります。この需要に基づいて、FMZ プラットフォームはカスタム描画機能をアップグレードし、その用途を拡大しました。KLineChartこの関数はカスタム チャートの描画を実行します。 API ドキュメントを参照してください: https://www.fmz.com/api#klinechart
JavaScript を使用して、遷移を行う簡単な例を記述してみましょう。
簡単な例
javascript
/*backtest
start: 2022-03-21 09:00:00
end: 2022-06-21 15:00:00
period: 30m
basePeriod: 15m
exchanges: [{"eid":"Binance","currency":"BTC_USDT"}]
*/
function main() {
var c = KLineChart()
while (true) {
var bars = _C(exchange.GetRecords)
for (var i = 0 ; i < bars.length ; i++) {
var bar = bars[i]
c.begin(bar)
c.plot(bar.Volume, "volume")
c.close()
}
Sleep(1000)
}
}
この例は非常に単純です。戦略のカスタム描画領域にローソク足チャートを描画し、チャートのサブチャート位置に各ローソク足BARに対応するボリューム曲線を描画するだけです。
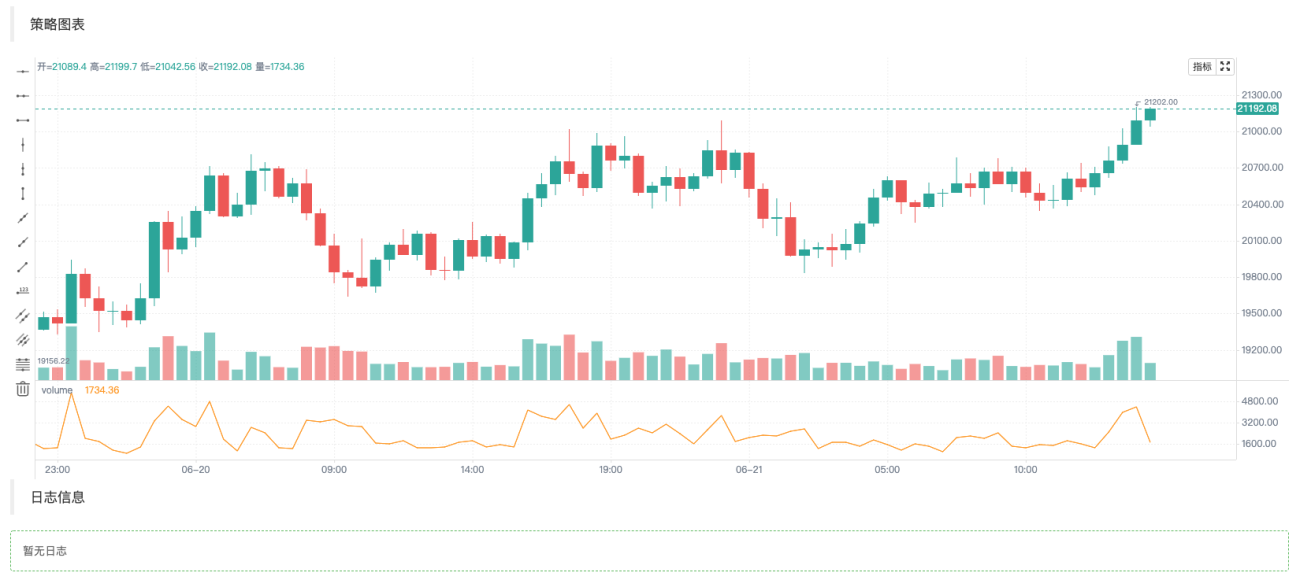
最初に使用するコードではvar c = KLineChart()チャート オブジェクトを作成し、そのメソッドを呼び出して描画します。次に、ループ内で K ライン データ (配列構造) を取得し、K ライン配列を走査します。例のように単純な for ループを使用して走査することも、他の方法を使用して走査することもできます。
描画操作は以下から行う必要がありますc.begin(bar)関数が開始され、c.close()関数は終了します。begin、close関数はチャート オブジェクト c のメソッドです。次に、最もよく使われる描画機能を使用しますplot各バーにボリューム カーブを描画します。
より複雑な例
ボリンジャーインジケーターを使用してチャートを設計するとします。ああそうだ!また、各 BAR にボリューム チャートを添付する必要があり、次のように設計できます。
            javascript

            /*backtest
start: 2022-03-21 09:00:00
end: 2022-06-21 15:00:00
period: 1d
basePeriod: 1h
exchanges: [{"eid":"Binance","currency":"BTC_USDT"}]
*/

function main() {
    var c = KLineChart()

    // 策略主循环
    while(true) {
        // 轮询间隔
        Sleep(500)

        // 获取K线数据
        let bars = exchange.GetRecords()
        if (!bars || bars.length <= 20) {
            continue
        }

        // 计算布林指标
        var boll = TA.BOLL(bars)

        bars.forEach(function(bar, index) {
            c.begin(bar)
            // 画图操作
            c.plot(boll[0][index], "Boll_Up", {overlay: true})     // 画在图表主图
            c.plot(boll[1][index], "Boll_Mid", {overlay: true})    // 画在图表主图
            c.plot(boll[2][index], "Boll_Down", {overlay: true})   // 画在图表主图
            c.plot(bar.Volume, "volume")                           // 画在图表副图
            c.close()
        })

        // 策略交易逻辑
        // ...
        // ..
    }
}
コードを見ると、FMZ プラットフォーム上のバックテスト構成情報は次のようになっていることがわかります。
            /*backtest
start: 2022-03-21 09:00:00
end: 2022-06-21 15:00:00
period: 1d
basePeriod: 1h
exchanges: [{"eid":"Binance","currency":"BTC_USDT"}]
*/
この構成は、Binance スポット取引オブジェクトを使用してバックテストされています。バックテストの結果は図に示されています。
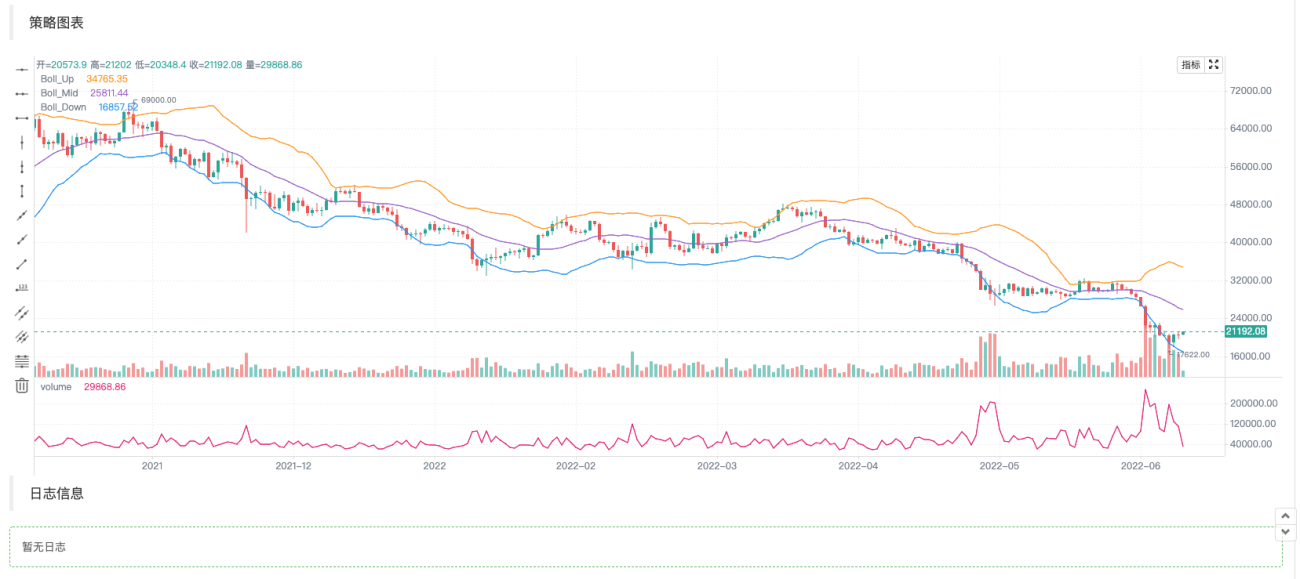
Pine の描画メソッドを使用すると、JavaScript 言語での描画コードが大幅に簡素化されることがわかります。
インジケーターやその他のデータを書き込んで絵を描く
K ライン データの取得や指標の計算などの操作は、プラットフォームの戦略スクエアの戦略例や API ドキュメントでは一般的で非常に簡単です。
            javascript

                    // 获取K线数据
        let bars = exchange.GetRecords()
        if (!bars || bars.length <= 20) {
            // 如果获取K线失败,即!bar为真则执行continue,忽略之后的代码,重新执行循环
            // 如果bars.length小于等于20,即K线BAR(柱)数量小于20,无法计算指标,也执行continue
            continue
        }

        // 计算布林指标
        var boll = TA.BOLL(bars)
ボリンジャー指標計算関数TA.BOLL、ボリンジャー指標パラメータを指定しない場合は、デフォルトのパラメータが使用されます。BOLL(20, 2)。 Bollinger インジケーターには 3 つのラインがあるため、TA.BOLL 関数によって返されるデータは 2 次元配列になります。ボール[0]、boll[1]、boll[2]はボール配列の3つの要素であり、それぞれが行を表し、配列です。
- boll[0]: ボリンジャーバンドオンライン
- boll[1]: ボリンジャーバンド中間線
- boll[2]: ボリンジャーバンドが下落
次に、K ライン データのボリューム、つまり取引量と、計算されたボリンジャー インジケーター データをチャート上に描画する方法を説明します。
K ライン データをバーごとに描画するため、K ライン配列全体、つまりコード内のバー配列を走査する必要があります。ここではforEachメソッドのトラバーサルは、 for ループを使用してトラバースすることもできます。
            javascript

                    bars.forEach(function(bar, index) {
            c.begin(bar)
            // 画图操作
            c.plot(boll[0][index], "Boll_Up", {overlay: true})     // {overlay: true}参数控制,画在图表主图
            c.plot(boll[1][index], "Boll_Mid", {overlay: true})    // 画在图表主图
            c.plot(boll[2][index], "Boll_Down", {overlay: true})   // 画在图表主图
            c.plot(bar.Volume, "volume")                           // 画在图表副图
            c.close()
        })
バーチャートを描き始めるたびに、まずc.begin(bar)関数呼び出し、begin関数はチャート オブジェクト c のメソッドです。描画操作の最後に、c.close()。存在するbegin機能とclose関数の間には、Pine 言語の描画方法に似た、呼び出す描画関数があります。サポート:barcolor bgcolor plot fill hline plotarrow plotshape plotchar plotcandle signal線や矢印を描いたり、情報をマークしたりすることができます。これらの関数のパラメータは、Pine 言語の対応する関数パラメータと一致しており、描画関数も一致しています。
取引シグナル矢印、マーカー、水平線、その他の描画を追加しました
上記のボリンジャー インジケーターの描画例に、いくつかの取引シグナル矢印、マーカー、および水平線を追加します。
            javascript

            /*backtest
start: 2022-03-21 09:00:00
end: 2022-06-21 15:00:00
period: 1d
basePeriod: 1h
exchanges: [{"eid":"Binance","currency":"BTC_USDT"}]
*/

function main() {
    var c = KLineChart()

    // 策略主循环
    while(true) {
        // 轮询间隔
        Sleep(500)

        // 获取K线数据
        let bars = exchange.GetRecords()
        if (!bars || bars.length <= 20) {
            continue
        }

        // 计算布林指标
        var boll = TA.BOLL(bars)

        bars.forEach(function(bar, index) {
            c.begin(bar)
            // 画图操作
            c.plot(boll[0][index], "Boll_Up", {overlay: true})     // 画在图表主图
            c.plot(boll[1][index], "Boll_Mid", {overlay: true})    // 画在图表主图
            c.plot(boll[2][index], "Boll_Down", {overlay: true})   // 画在图表主图
            c.plot(bar.Volume, "volume")                           // 画在图表副图

            c.hline(bar.Open, {overlay: true})                                         // 水平线
            c.plotarrow(bar.Close - bar.Open, {overlay: true})                         // 箭头
            c.plotshape(bar.Close - bar.Open > 0, {style: 'square', overlay: true})    // 画方块标记
            c.plotchar(bar.Close - bar.Open < 0, {char: '❄', size: "20px", overlay: true})           // 画出字符❄
            if (boll[0][index] && bar.Close > boll[0][index]) {
                c.signal("long", bar.Close, 1.5)
            } else if (boll[2][index] && bar.Close < boll[2][index]) {
                c.signal("closelong", bar.Close, 1.5)
            }

            c.close()
        })

        // 策略交易逻辑
        // ...
        // ..
    }
}
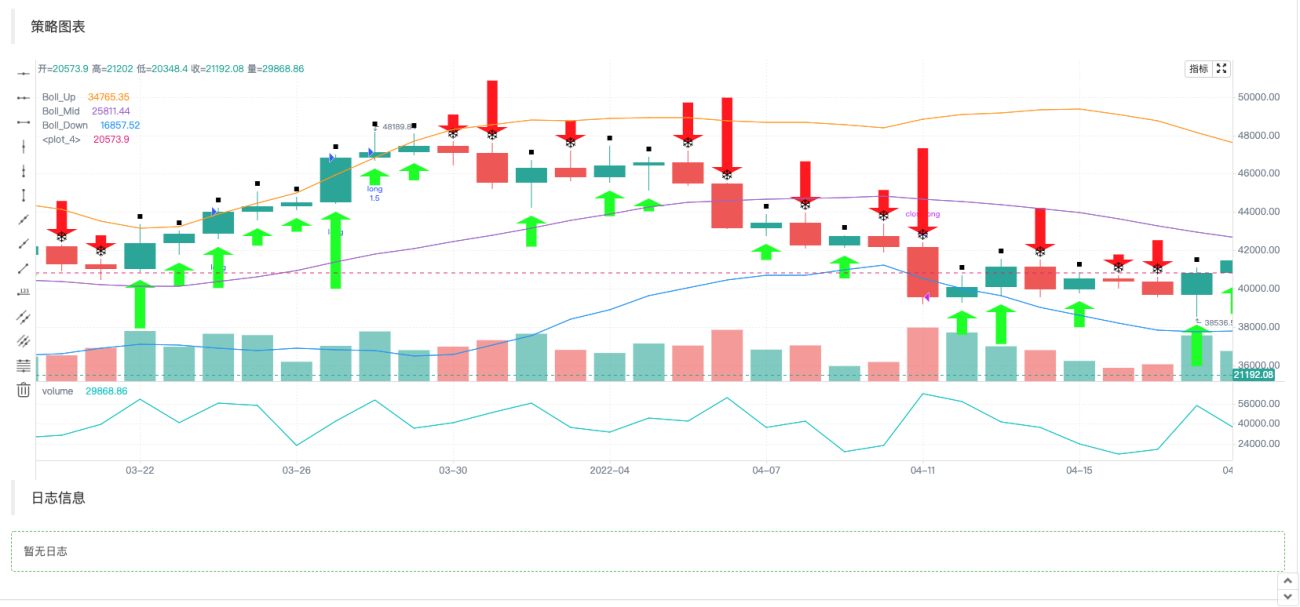
Pine言語戦略注文操作はチャート上のシグナルを自動的にマークするので、KLineChartこの関数によって作成されたチャート オブジェクトには、買いシグナル マーカーと売りシグナル マーカーを描画する関数も拡張されています。c.signal。
チャート構成オブジェクト
チャートのスタイルを設定するための構造体を宣言できます。たとえば、次の chartCfg 変数はグリッド線の設定情報を表します。
            javascript

                var chartCfg = {
        grid: {
            show: true,
            // 网格水平线
            horizontal: {
                show: true,
                size: 2,
                color: '#FF0000',    // 水平网格线的颜色
                // 'solid'|'dash'
                style: 'dash',       // 线的类型
                dashValue: [2, 2]
            },
   	        // 网格垂直线
            vertical: {
                show: true,
                size: 2,
                color: '#32CD32',
                // 'solid'|'dash'
                style: 'solid',
                dashValue: [2, 2]
            }
        },
    }
チャート構成オブジェクトは、チャートのいくつかのプロパティと外観を設定するデータ構造です。たとえば、この例ではグリッド線のスタイル構成を使用しています。 X軸とY軸の関連設定、カーソルラインの設定、プロンプト情報の設定、テクニカル指標のスタイルの設定など、設定および変更できるオプションも多数あります。 KラインBARスタイルの設定など
もちろん、これらに詳しくない方は、KLineChartこの関数は、チャート オブジェクトを作成するときにチャート構成オブジェクトを渡す必要はありません。作成されたグラフはデフォルトのスタイルになります。 FMZプラットフォームのAPI機能の使用KLineChartチャートオブジェクトを作成する関数:
            javascript

            var c = KLineChart(chartCfg)
グリッド線を描画するためのテストコード:
            javascript

            /*backtest
start: 2022-03-21 09:00:00
end: 2022-06-21 15:00:00
period: 1d
basePeriod: 1h
exchanges: [{"eid":"Binance","currency":"BTC_USDT"}]
*/

function main() {
    var chartCfg = {
        grid: {
            show: true,
            // 网格水平线
            horizontal: {
                show: true,
                size: 2,
                color: '#FF0000',
                // 'solid'|'dash'
                style: 'dash',
                dashValue: [2, 2]
            },
   	        // 网格垂直线
            vertical: {
                show: true,
                size: 2,
                color: '#32CD32',
                // 'solid'|'dash'
                style: 'solid',
                dashValue: [2, 2]
            }
        },
    }

    var c = KLineChart(chartCfg)

    // 策略主循环
    while(true) {
        // 轮询间隔
        Sleep(500)

        // 获取K线数据
        var bars = _C(exchange.GetRecords)
        bars.forEach(function(bar, index) {
            c.begin(bar)
            c.close()
        })

        // 策略交易逻辑
        // ...
        // ..
    }
}
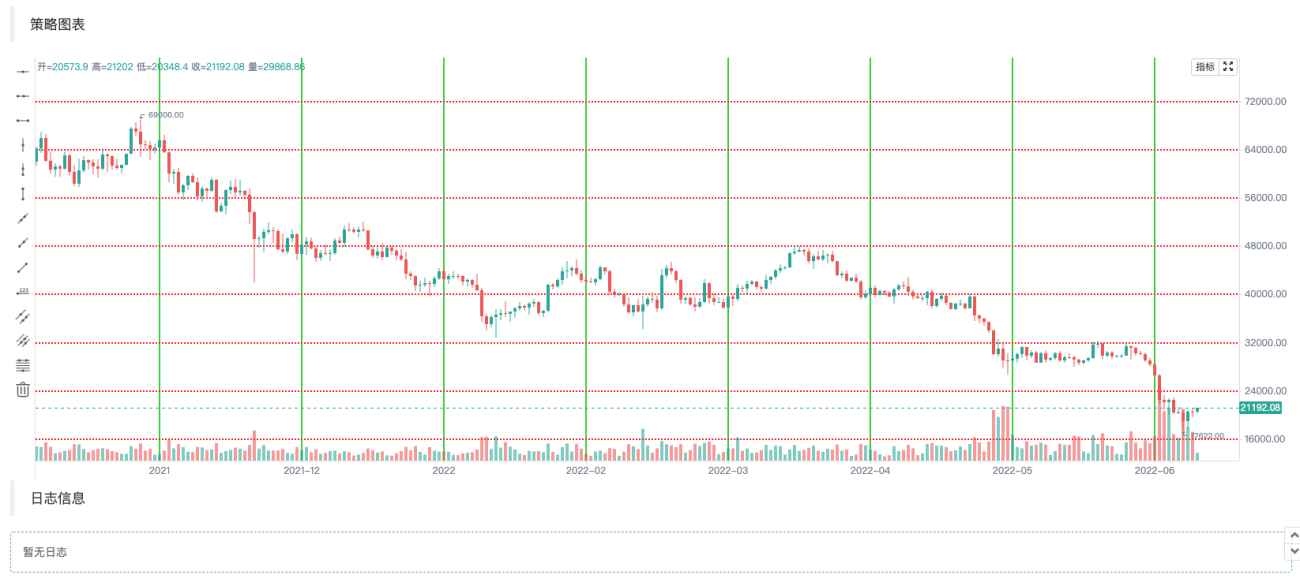
チャート構成スタイルの例
チャート構成スタイルの設定を参照するために使用できます。
javascript
{
// 网格线
grid: {
show: true,
// 网格水平线
horizontal: {
show: true,
size: 1,
color: '#393939',
// 'solid'|'dash'
style: 'dash',
dashValue: [2, 2]
},
// 网格垂直线
vertical: {
show: false,
size: 1,
color: '#393939',
// 'solid'|'dash'
style: 'dash',
dashValue: [2, 2]
}
},
// 蜡烛图
candle: {
// 蜡烛图上下间距,大于1为绝对值,大于0小余1则为比例
margin: {
top: 0.2,
bottom: 0.1
},
// 蜡烛图类型 'candle_solid'|'candle_stroke'|'candle_up_stroke'|'candle_down_stroke'|'ohlc'|'area'
type: 'candle_solid',
// 蜡烛柱
bar: {
upColor: '#26A69A',
downColor: '#EF5350',
noChangeColor: '#888888'
},
// 面积图
area: {
lineSize: 2,
lineColor: '#2196F3',
value: 'close',
backgroundColor: [{
offset: 0,
color: 'rgba(33, 150, 243, 0.01)'
}, {
offset: 1,
color: 'rgba(33, 150, 243, 0.2)'
}]
},
priceMark: {
show: true,
// 最高价标记
high: {
show: true,
color: '#D9D9D9',
textMargin: 5,
textSize: 10,
textFamily: 'Helvetica Neue',
textWeight: 'normal'
},
// 最低价标记
low: {
show: true,
color: '#D9D9D9',
textMargin: 5,
textSize: 10,
textFamily: 'Helvetica Neue',
textWeight: 'normal',
},
// 最新价标记
last: {
show: true,
upColor: '#26A69A',
downColor: '#EF5350',
noChangeColor: '#888888',
line: {
show: true,
// 'solid'|'dash'
style: 'dash',
dashValue: [4, 4],
size: 1
},
text: {
show: true,
size: 12,
paddingLeft: 2,
paddingTop: 2,
paddingRight: 2,
paddingBottom: 2,
color: '#FFFFFF',
family: 'Helvetica Neue',
weight: 'normal',
borderRadius: 2
}
}
},
// 提示
tooltip: {
// 'always' | 'follow_cross' | 'none'
showRule: 'always',
// 'standard' | 'rect'
showType: 'standard',
labels: ['时间', '开', '收', '高', '低', '成交量'],
values: null,
defaultValue: 'n/a',
rect: {
paddingLeft: 0,
paddingRight: 0,
paddingTop: 0,
paddingBottom: 6,
offsetLeft: 8,
offsetTop: 8,
offsetRight: 8,
borderRadius: 4,
borderSize: 1,
borderColor: '#3f4254',
backgroundColor: 'rgba(17, 17, 17, .3)'
},
text: {
size: 12,
family: 'Helvetica Neue',
weight: 'normal',
color: '#D9D9D9',
marginLeft: 8,
marginTop: 6,
marginRight: 8,
marginBottom: 0
}
}
},
// 技术指标
technicalIndicator: {
margin: {
top: 0.2,
bottom: 0.1
},
bar: {
upColor: '#26A69A',
downColor: '#EF5350',
noChangeColor: '#888888'
},
line: {
size: 1,
colors: ['#FF9600', '#9D65C9', '#2196F3', '#E11D74', '#01C5C4']
},
circle: {
upColor: '#26A69A',
downColor: '#EF5350',
noChangeColor: '#888888'
},
// 最新值标记
lastValueMark: {
show: false,
text: {
show: false,
color: '#ffffff',
size: 12,
family: 'Helvetica Neue',
weight: 'normal',
paddingLeft: 3,
paddingTop: 2,
paddingRight: 3,
paddingBottom: 2,
borderRadius: 2
}
},
// 提示
tooltip: {
// 'always' | 'follow_cross' | 'none'
showRule: 'always',
// 'standard' | 'rect'
showType: 'standard',
showName: true,
showParams: true,
defaultValue: 'n/a',
text: {
size: 12,
family: 'Helvetica Neue',
weight: 'normal',
color: '#D9D9D9',
marginTop: 6,
marginRight: 8,
marginBottom: 0,
marginLeft: 8
}
}
},
// x轴
xAxis: {
show: true,
height: null,
// x轴线
axisLine: {
show: true,
color: '#888888',
size: 1
},
// x轴分割文字
tickText: {
show: true,
color: '#D9D9D9',
family: 'Helvetica Neue',
weight: 'normal',
size: 12,
paddingTop: 3,
paddingBottom: 6
},
// x轴分割线
tickLine: {
show: true,
size: 1,
length: 3,
color: '#888888'
}
},
// y轴
yAxis: {
show: true,
width: null,
// 'left' | 'right'
position: 'right',
// 'normal' | 'percentage' | 'log'
type: 'normal',
inside: false,
reverse: false,
// y轴线
axisLine: {
show: true,
color: '#888888',
size: 1
},
// y轴分割文字
tickText: {
show: true,
color: '#D9D9D9',
family: 'Helvetica Neue',
weight: 'normal',
size: 12,
paddingLeft: 3,
paddingRight: 6
},
// y轴分割线
tickLine: {
show: true,
size: 1,
length: 3,
color: '#888888'
}
},
// 图表之间的分割线
separator: {
size: 1,
color: '#888888',
fill: true,
activeBackgroundColor: 'rgba(230, 230, 230, .15)'
},
// 十字光标
crosshair: {
show: true,
// 十字光标水平线及文字
horizontal: {
show: true,
line: {
show: true,
// 'solid'|'dash'
style: 'dash',
dashValue: [4, 2],
size: 1,
color: '#888888'
},
text: {
show: true,
color: '#D9D9D9',
size: 12,
family: 'Helvetica Neue',
weight: 'normal',
paddingLeft: 2,
paddingRight: 2,
paddingTop: 2,
paddingBottom: 2,
borderSize: 1,
borderColor: '#505050',
borderRadius: 2,
backgroundColor: '#505050'
}
},
// 十字光标垂直线及文字
vertical: {
show: true,
line: {
show: true,
// 'solid'|'dash'
style: 'dash',
dashValue: [4, 2],
size: 1,
color: '#888888'
},
text: {
show: true,
color: '#D9D9D9',
size: 12,
family: 'Helvetica Neue',
weight: 'normal',
paddingLeft: 2,
paddingRight: 2,
paddingTop: 2,
paddingBottom: 2,
borderSize: 1,
borderColor: '#505050',
borderRadius: 2,
backgroundColor: '#505050'
}
}
},
// 图形
shape: {
point: {
backgroundColor: '#2196F3',
borderColor: '#2196F3',
borderSize: 1,
radius: 4,
activeBackgroundColor: '#2196F3',
activeBorderColor: '#2196F3',
activeBorderSize: 1,
activeRadius: 6
},
line: {
// 'solid'|'dash'
style: 'solid'
color: '#2196F3',
size: 1,
dashValue: [2, 2]
},
polygon: {
// 'stroke'|'fill'
style: 'stroke',
stroke: {
// 'solid'|'dash'
style: 'solid',
size: 1,
color: '#2196F3',
dashValue: [2, 2]
},
fill: {
color: 'rgba(33, 150, 243, 0.1)'
}
},
arc: {
// 'stroke'|'fill'
style: 'stroke',
stroke: {
// 'solid'|'dash'
style: 'solid',
size: 1,
color: '#2196F3',
dashValue: [2, 2]
},
fill: {
color: '#2196F3'
}
},
text: {
style: 'fill',
color: '#2196F3',
size: 12,
family: 'Helvetica Neue',
weight: 'normal',
offset: [0, 0]
}
},
annotation: {
// 'top' | 'bottom' | 'point'
position: 'top',
offset: [20, 0]
symbol: {
// 'diamond' | 'circle' | 'rect' | 'triangle' | 'custom' | 'none'
type: 'diamond',
size: 8,
color: '#2196F3',
activeSize: 10,
activeColor: '#FF9600'
}
},
tag: {
// 'top' | 'bottom' | 'point'
position: 'point',
offset: 0,
line: {
show: true,
style: LineStyle.DASH,
dashValue: [4, 2],
size: 1,
color: '#2196F3'
},
text: {
color: '#FFFFFF',
backgroundColor: '#2196F3',
size: 12,
family: 'Helvetica Neue',
weight: 'normal',
paddingLeft: 2,
paddingRight: 2,
paddingTop: 2,
paddingBottom: 2,
borderRadius: 2,
borderSize: 1,
borderColor: '#2196F3'
},
mark: {
offset: 0,
color: '#FFFFFF',
backgroundColor: '#2196F3',
size: 12,
family: 'Helvetica Neue',
weight: 'normal',
paddingLeft: 2,
paddingRight: 2,
paddingTop: 2,
paddingBottom: 2,
borderRadius: 2,
borderSize: 1,
borderColor: '#2196F3'
}
}
}
こうすると戦略の立案や設計が簡単になるのではないでしょうか?

梦总,感谢分享!
我请教一个场景,不知道现阶段使用KLineChart能否实现。 具体场景说明:
1、策略是多品种交易 ;
2、加载策略的时候,默认指定的品种进行图表的绘制,包括K线、指标、交易信号等等;
3、通过筛选框,选择其他的交易品种,获取历史K线绘制图表,直到当前时间对应的K线。
目的在于通过图表直接观察各个交易品种是否是合理开平仓的,交易是否正常。

1、策略是多品种交易 ;
对于多图表,KLineChart 函数不支持,可以使用画图接口Chart函数,可以参考多图表画线类库的设计。
2、加载策略的时候,默认指定的品种进行图表的绘制,包括K线、指标、交易信号等等;
单图表可以实现。
3、通过筛选框,选择其他的交易品种,获取历史K线绘制图表,直到当前时间对应的K线。
单图表可以实现,可以具体编写代码查询历史K线数据然后填充画图.
如果是多品种策略,建议使用Chart函数画图。KLineChart 函数目前只能单图表画图。
- 1