最良のスーパートレンド戦略
作者: リン・ハーンチャオチャン, 日付: 2023-09-09 22:18:31タグ:
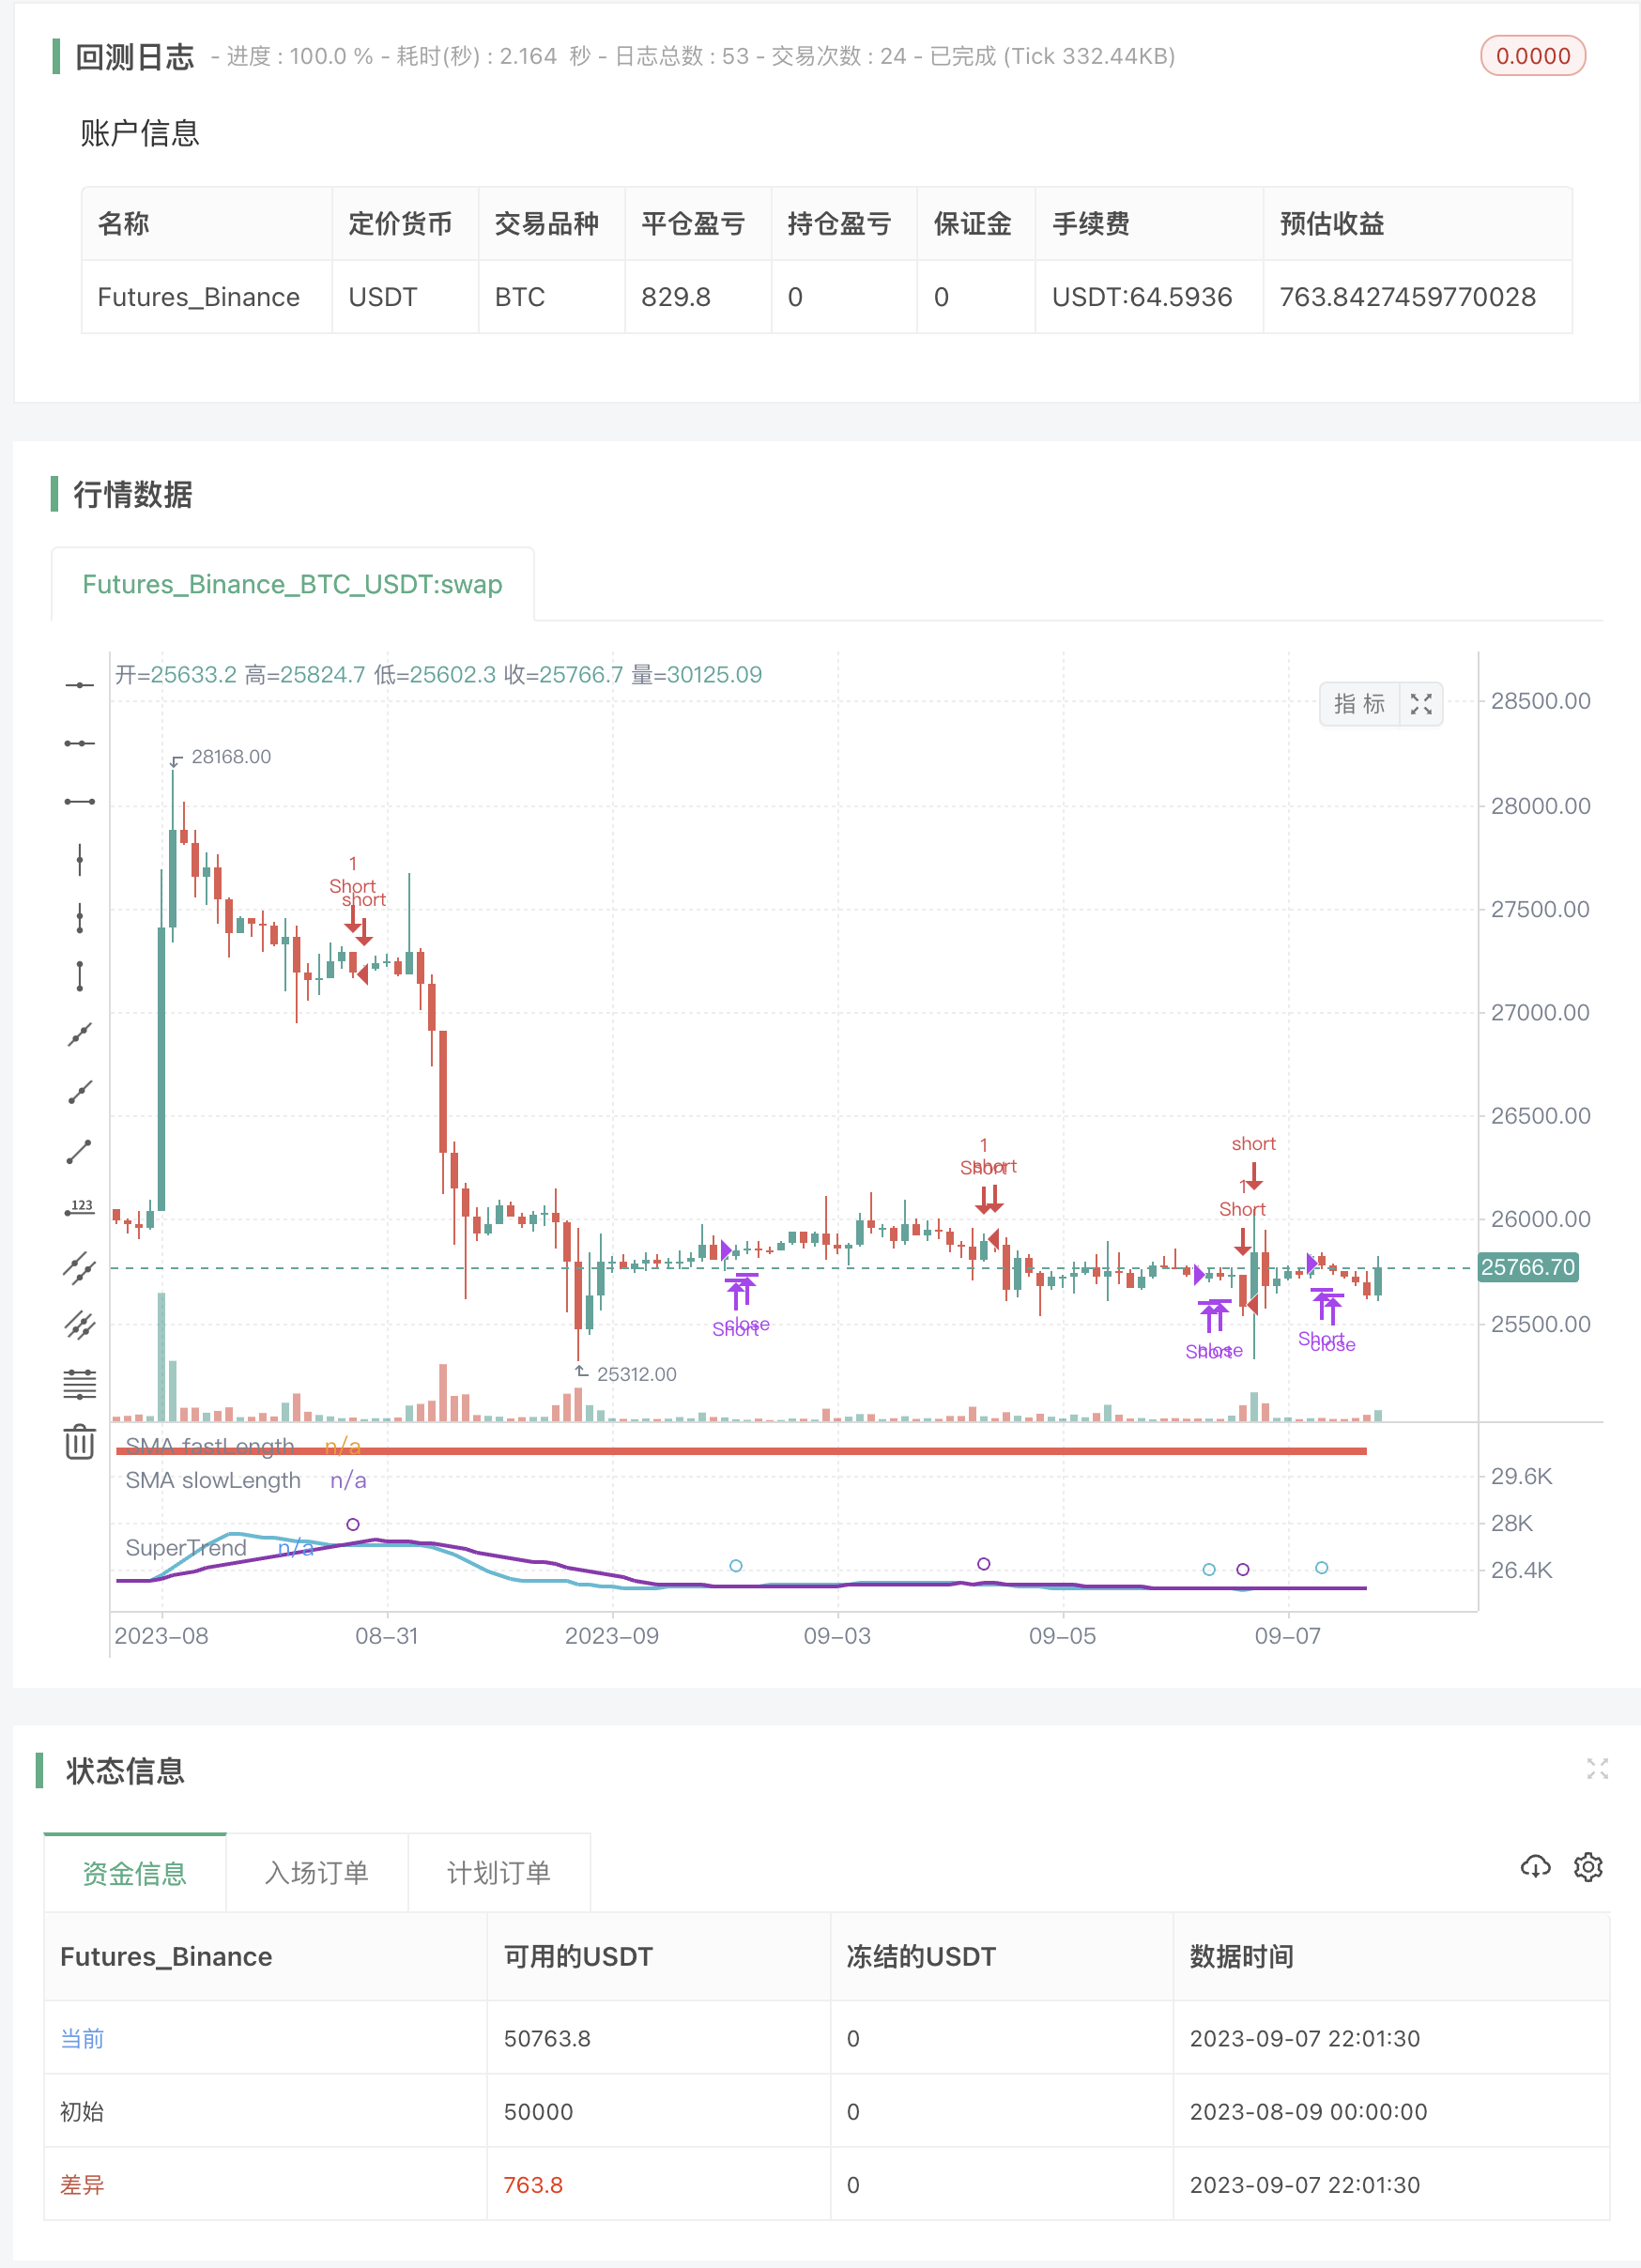 スーパートレンド戦略は,上向き市場と下向き市場の両方から利益を得るために使用できるシンプルで効果的な取引戦略です.この戦略は,現在のトレンドと潜在的な逆転点を特定するのに役立つトレンドフォローする指標であるスーパートレンド指標に基づいています.
BESTスーパートレンド戦略は,より高い因数と期間を使用する標準スーパートレンド戦略の修正である.これは,傾向の変化により敏感な指標となり,より収益性の高い取引機会を特定するのに役立ちます.
この戦略は,価格がスーパートレンドラインを突破するとロングトレードを入力し,価格がスーパートレンドラインを突破するとロングトレードを終了することで機能します.価格がスーパートレンドラインを下回るとショートトレードを入力し,価格がスーパートレンドラインを突破すると終了します.
ベスト・スーパートレンド戦略は,あらゆる経験レベルのトレーダーが使用できるシンプルで効果的な戦略です.ストップ損失を制限するためにストップ損失を使用しているため,この戦略は比較的リスクが低いものです.
BEST スーパートレンド戦略を使用する利点のいくつかです.
シンプルで分かりやすい 上向き市場と下向き市場の両方で有効 低リスク 収益性 シンプルで効果的な取引戦略を探している場合は,ベストスーパートレンド戦略は素晴らしいオプションです. 戦略は学習し,使用しやすく,上向きと下向きの市場の両方で利益を生む可能性があります.
BEST スーパートレンド戦略の使い方について以下のようなアドバイスがあります
高い因数と期間を使用して,傾向の変化により敏感な指標を作ります. 損失を制限するためにストップ損失を使う. リスク管理のために サイズが小さい取引をします 戦略の実績を見るために 歴史的なデータでバックテストします BEST スーパートレンド戦略は,取引を開始するための素晴らしい方法です.それはあらゆる経験レベルのトレーダーが使用できるシンプルで効果的な戦略です.あなたが市場から利益を得る方法を探している場合は,BEST スーパートレンド戦略は素晴らしいオプションです.
/*backtest
start: 2023-08-09 00:00:00
end: 2023-09-08 00:00:00
period: 2h
basePeriod: 15m
exchanges: [{"eid":"Futures_Binance","currency":"BTC_USDT"}]
args: [["v_input_4",2]]
*/

//@version=4
//@author=Daveatt

// strategy(title="BEST Supertrend Strategy", shorttitle="Supertrend Strategy", overlay=true,
//  pyramiding=0, default_qty_value=100, precision=7, currency=currency.USD,
//  commission_value=0.2,commission_type=strategy.commission.percent, initial_capital=1000000)


///////////////////////////////////////////////////////////////////////////////
///////////////////////////////////////////////////////////////////////////////
/////////////////////////// Strategy Component /////////////////////////////////
///////////////////////////////////////////////////////////////////////////////
///////////////////////////////////////////////////////////////////////////////

orderType = input("Longs+Shorts",title="What type of Orders", options=["Longs+Shorts","LongsOnly","ShortsOnly"])
isLong   = (orderType != "ShortsOnly")
isShort  = (orderType != "LongsOnly")

// SMA
fastLength = input(7, title="Fast Length SMA")
slowLength = input(20, title="Slow Length SMA")

///////////////////////////////////////////////////////////////////////////////
///////////////////////////////////////////////////////////////////////////////
///////////////////////////// SUPERTREND /////////////////////////////////////
///////////////////////////////////////////////////////////////////////////////
///////////////////////////////////////////////////////////////////////////////

Factor=input(3,title="[ST] Factor", minval=1,maxval = 100, type=input.float)
Pd=input(3, title="[ST] PD", minval=1,maxval = 100)
TF=input("daily", title="Supertrend timeframe", options=["daily","weekly","monthly","quartly","yearly"])

//////////////////////////
//* COLOR CONSTANTS *//
//////////////////////////

AQUA = #00FFFFFF
BLUE = #0000FFFF
RED  = #FF0000FF
LIME = #00FF00FF
GRAY = #808080FF
DARKRED   = #8B0000FF
DARKGREEN = #006400FF
GOLD = #FFD700
WHITE = color.white

// Plots
GREEN_LIGHT     = color.new(color.green, 40)
RED_LIGHT       = color.new(color.red, 40)
BLUE_LIGHT      = color.new(color.aqua, 40)
PURPLE_LIGHT    = color.new(color.purple, 40)


///////////////////////////////////////////////////////////////////////////////
///////////////////////////////////////////////////////////////////////////////
/////////////////////// SUPERTREND DETECTION //////////////////////////////////
///////////////////////////////////////////////////////////////////////////////
///////////////////////////////////////////////////////////////////////////////

f_supertrend(Factor, Pd) =>

    Up=hl2-(Factor*atr(Pd))
    Dn=hl2+(Factor*atr(Pd))

    TrendUp = 0.0
    TrendUp := close[1]>TrendUp[1] ? max(Up,TrendUp[1]) : Up
    TrendDown = 0.0
    TrendDown := close[1]<TrendDown[1]? min(Dn,TrendDown[1]) : Dn
    Trend = 0.0
    Trend := close > TrendDown[1] ? 1: close< TrendUp[1]? -1: nz(Trend[1],1)
    Tsl = Trend==1? TrendUp: TrendDown

    Tsl

st_tsl = f_supertrend(Factor, Pd)

///////////////////////////////////////////////////////////////////////////////
///////////////////////////////////////////////////////////////////////////////
////////////////////////// MULTI TIMEFRAMES CALCS /////////////////////////////
///////////////////////////////////////////////////////////////////////////////
///////////////////////////////////////////////////////////////////////////////


f_securitys(_ticker, _source)=>

    daily = security(_ticker, 'D', _source[1], lookahead=true)
    weekly = security(_ticker, 'W', _source[1], lookahead=true)
    montly = security(_ticker, 'M', _source[1], lookahead=true)
    quarterly = security(_ticker, '3M', _source[1], lookahead=true)
    yearly = security(_ticker, '12M', _source[1], lookahead=true)

    [daily, weekly, montly, quarterly, yearly]


[st_daily, st_weekly, st_monthly, st_quarterly, st_yearly] = f_securitys(syminfo.tickerid, st_tsl)

lapos_x = timenow + round(change(time)*50)
lapos_y = close

down_arrows_text = "▼" + " " + "▼" + " " + "▼" + " " + "▼" + " " + "▼" + " " + "▼" + " " + "▼" + "\n"

// Drawing function designed by RicardoSantos.
f_draw_infopanel(_x, _y, _color, _line, _text)=>
    _rep_text = ""
    for _l = 0 to _line
        _rep_text := _rep_text + "\n"
    _rep_text := _rep_text + _text

    var label _la = na
    label.delete(_la)
    _la := label.new(x=_x, y=_y, text=_rep_text, xloc=xloc.bar_time, yloc=yloc.price,
     color=#C1CADE,  textcolor=_color, size=size.normal)

// Using the JustUncleL reverse order trick
f_draw_infopanel(lapos_x, lapos_y, color.olive,                 12, "╚═══════════════════════╝")
f_draw_infopanel(lapos_x, lapos_y, color.new(color.red, 20),    10,  "Yearly : " + tostring(round(st_yearly)))
f_draw_infopanel(lapos_x, lapos_y, color.new(color.purple, 20), 8,  "Quarterly : " + tostring(round(st_quarterly)))
f_draw_infopanel(lapos_x, lapos_y, color.new(color.green, 20),  6,  "Monthly : " + tostring(round(st_monthly)))
f_draw_infopanel(lapos_x, lapos_y, color.new(color.blue, 20),   4,  "Weekly : " +  tostring(round(st_weekly)))
f_draw_infopanel(lapos_x, lapos_y, color.new(color.green, 20),  2,  "Daily : " +  tostring(round(st_daily)))
f_draw_infopanel(lapos_x, lapos_y, color.olive,                 0,  "╔═════ Supertrend (" + tostring(Factor) + "," + tostring(Pd) + ") ═════╗")

IS_DAILY = TF == "daily"
IS_WEEKLY = TF == "weekly"
IS_MONTHLY = TF == "monthly"
IS_QUARTERLY = TF == "quarterly"
IS_YEARLY = TF == "yearly"

// select right supertrend
st_tsl_TF = iff(IS_DAILY, st_daily,
 iff(IS_WEEKLY, st_weekly,
 iff(IS_MONTHLY, st_monthly,
 iff(IS_QUARTERLY, st_quarterly,
 iff(IS_YEARLY, st_yearly, st_daily)))))


// hard exit
sma_fast = sma(close, fastLength)
sma_slow = sma(close, slowLength)
long_exit     = crossunder(sma_fast,sma_slow)
short_exit    = crossover(sma_fast,sma_slow)

// MA Cross
curr = 0 - barssince(long_exit) + barssince(short_exit)
cross_buy = curr < 0 ?  1 : 0
cross_sell = curr > 0 ? 1  : 0

bull = close >= st_tsl_TF and cross_buy
bear = close <= st_tsl_TF and cross_sell
entry_price = valuewhen(bull or bear, close, 0)

plot(sma_fast, "SMA fastLength", color=color.aqua, linewidth=2)
plot(sma_slow, "SMA slowLength", color=color.purple, linewidth=2)
plotshape(crossover(sma_fast,sma_slow), color=color.aqua, style=shape.circle, size=size.small)
plotshape(crossunder(sma_fast,sma_slow), color=color.purple, style=shape.circle, size=size.small)

// Plot the ST
linecolor = close >= st_tsl_TF ? color.green : color.red
plot(st_tsl_TF, color = linecolor , linewidth = 4,title = "SuperTrend", transp=0)

// Strategy entries/exits
if isLong
    strategy.entry("Long", 1, when=bull)
    strategy.close("Long", when=long_exit)

if isShort
    strategy.entry("Short", 0,  when=bear)
    strategy.close("Short", when=short_exit )
- アップトレンドとオーバーセールド インデックス・スウィング・トレーディング・システム戦略
- 多項式回帰を用いた定量的なトレンド取引戦略
- コンボ バックテスト 123 リバースメント&相対変動指数
- SMA-3 トレーディング 戦略
- ボリンジャー・バンド自動取引戦略
- ジェネシス・クロスオーバー・トレーディング・戦略
- ガンボット 集団 の 戦略
- パア取引戦略
- ダイナミックな利益目標を持つオープンレンジ戦略
- 逆転戦略の勢いを絞る
- 逆転システム
- アダプティブ・ゼロ・レイグ・EMA戦略
- BVのICHIMOKUクラウド - すべての信号
- 相対強度指数戦略
- ボリンジャー・バンド + EMA 9
- シンプル EMA20 戦略 + ストカスティック
- NTPCclient UDP&& エクスチェンジサーバーの遅延
- VWMA + SMA ボリンジャーバンド + RSI 戦略:価格とボリュームの相関を分析する
- EMA200とストカスティックRSI戦略
- Trade05-K線サポート抵抗+ATR停止