MACD 動的ボラティリティ クロスオーバー予測戦略

1
Follow
1781
Followers
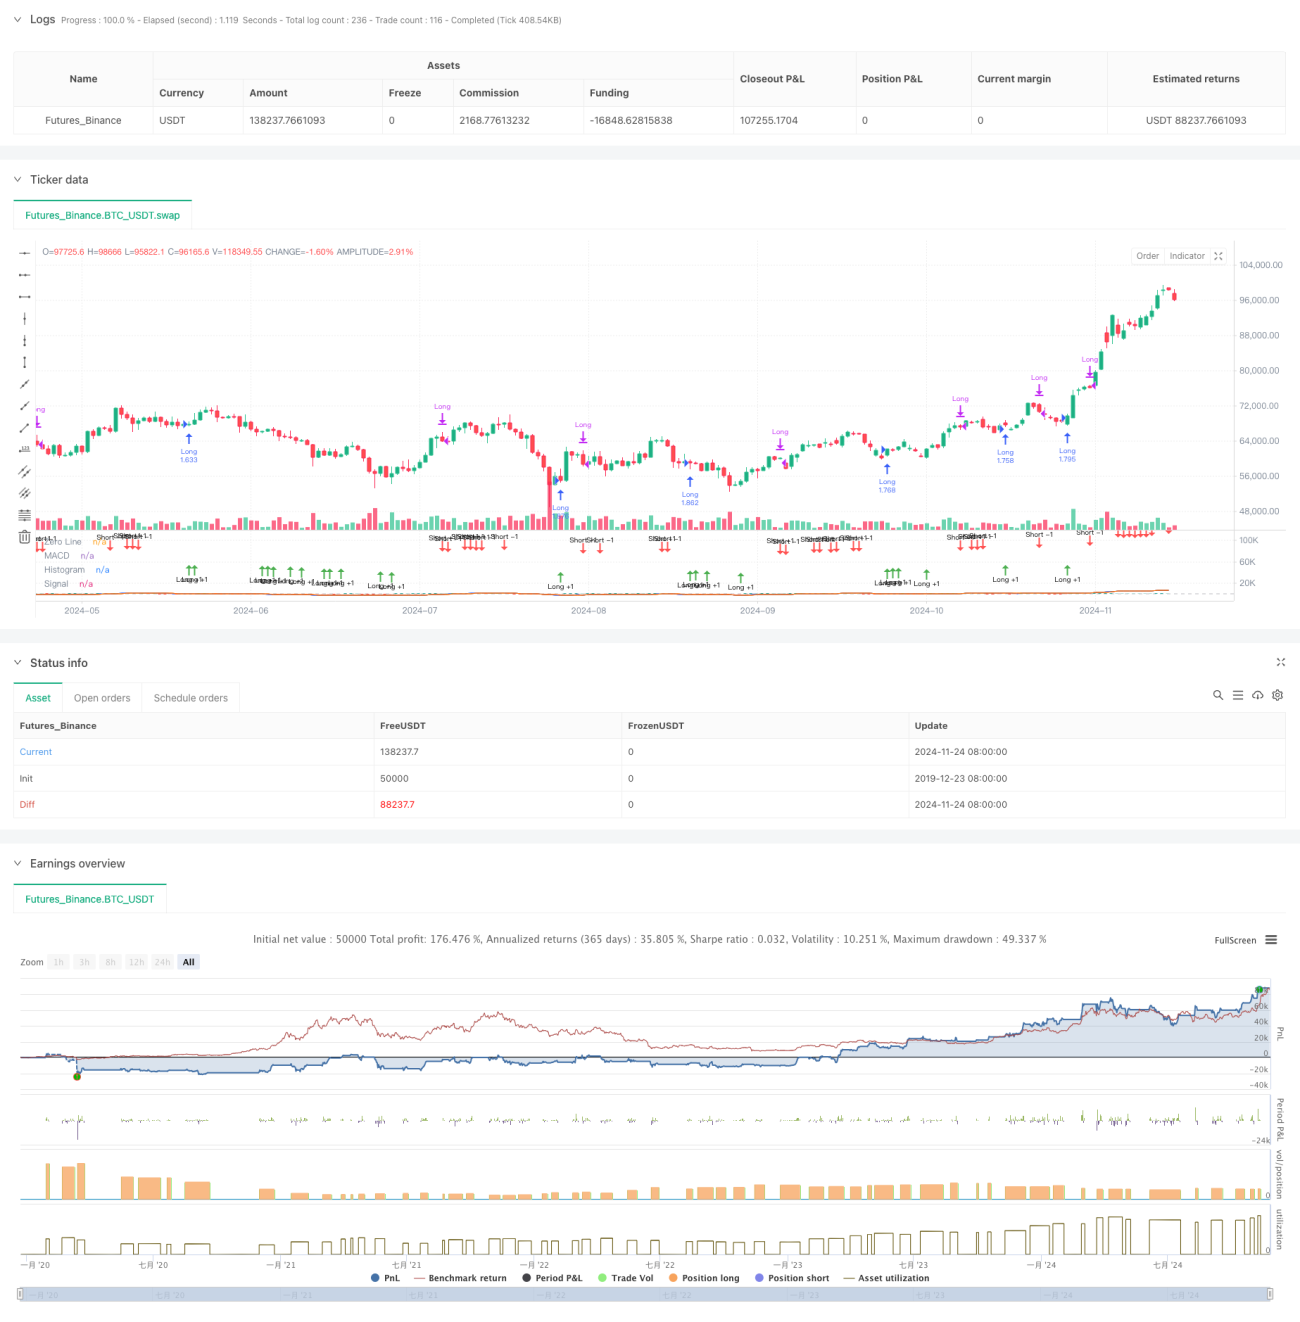
概要
この戦略は,MACD (移動平均収束散布指標) の動的変化特性をベースに取引決定を行う.戦略の核心は,MACD柱状図 (ヒストグラム) の変化傾向を観察して,発生する可能性のある金叉と死叉を予測して,取引を早期に配置することである.この戦略は,従来のMACD指標の交差信号だけでなく,柱状図の動的変化特性を重視し,交差信号を事前に判定することによって,より優越した場入り時間を獲得する.
戦略原則
策略は改良版のMACD指標システムを採用し,迅速な移動平均 ((EMA12) と遅い移動平均 ((EMA26) の差値計算,および2周期に基づく信号ラインを含んでいます. 核心取引ロジックは以下のいくつかのキーポイントに基づいています.
- 柱状図の変化率 ((hist_change) を計算してトレンドの動的変化を判断する
- 柱状図がマイナスで,連続3サイクルで上昇傾向を示しているとき,先行判断は金叉信号が発生し,早めに入場する.
- 柱状図が正し,連続3サイクルで下方傾向を示しているとき,先制判断でデッドフォーク信号が発生し,平仓出場
- 策略は,指定された時間枠内でのみ取引を行うための時間フィルターメカニズムを導入します.
戦略的優位性
- 信号予知性強:柱状図の動態変化を観察することで,発生する可能性のある交差信号を事前に予測し,入場タイミングを効果的に向上させる
- 合理的なリスク管理: 0.1%の手数料と3つの滑り点の取引コストを設定し,実際の取引状況に適合する
- 資金管理の柔軟性: ポジション管理に占める総口座額の割合で,リスクを効果的に管理する
- ビジュアル化効果は優れている.色彩の異なる標識の柱状のグラフが使用され,矢印で標識された取引信号が分析に便利である.
戦略リスク
- フェイクブレイクリスク:横盤の振動市場において頻繁に発生するフェイクブレイクシグナル
- 遅滞のリスク: MACD自体には遅滞があるが,先行判断のメカニズムがある
- 市場環境依存: 戦略は傾向がはっきりした市場で優れているが,波動的な市場では劣っている可能性がある
- パラメータの感受性: 快速または遅いライン周期の設定は,戦略のパフォーマンスに大きな影響を与える
戦略最適化の方向性
- 市場環境のフィルター導入:トレンド判断指標を追加し,異なる市場環境で異なる取引パラメータを使用
- ポジション管理の最適化:シグナル強度に応じてポジション保持比率を動的に調整できる
- 完善したストップメカニズム:追随ストップまたは固定ストップを追加して撤回を制御する
- 信号確認メカニズムの増強:他の技術指標と組み合わせたクロス検証により,信号の信頼性が向上する
- 最適化パラメータの選択:適応パラメータの方法を使用して,市場状況の動向に応じて指標パラメータを調整できます.
要約する
この戦略は,MACD柱状図の動的変化特性を革新的に適用することで,従来のMACD取引システムの改良と最適化を実現している.戦略の予判機構は,より早期の入場シグナルを提供でき,厳格な取引条件とリスク管理措置は,戦略の安定性を確保している.さらなる最適化と改善により,この戦略は,実際の取引においてより良いパフォーマンスを期待している.
Source
Pine
/*backtest
start: 2019-12-23 08:00:00
end: 2024-11-25 08:00:00
period: 1d
basePeriod: 1d
exchanges: [{"eid":"Futures_Binance","currency":"BTC_USDT"}]
*/

//@version=5
strategy(title="Demo GPT - Moving Average Convergence Divergence", shorttitle="MACD", commission_type=strategy.commission.percent, commission_value=0.1, slippage=3, default_qty_type=strategy.percent_of_equity, default_qty_value=100)

// Getting inputsStrategy parameters
Related strategies
Comment
All comments (0)
No data
- 1