
1
Follow
1780
Followers
概要
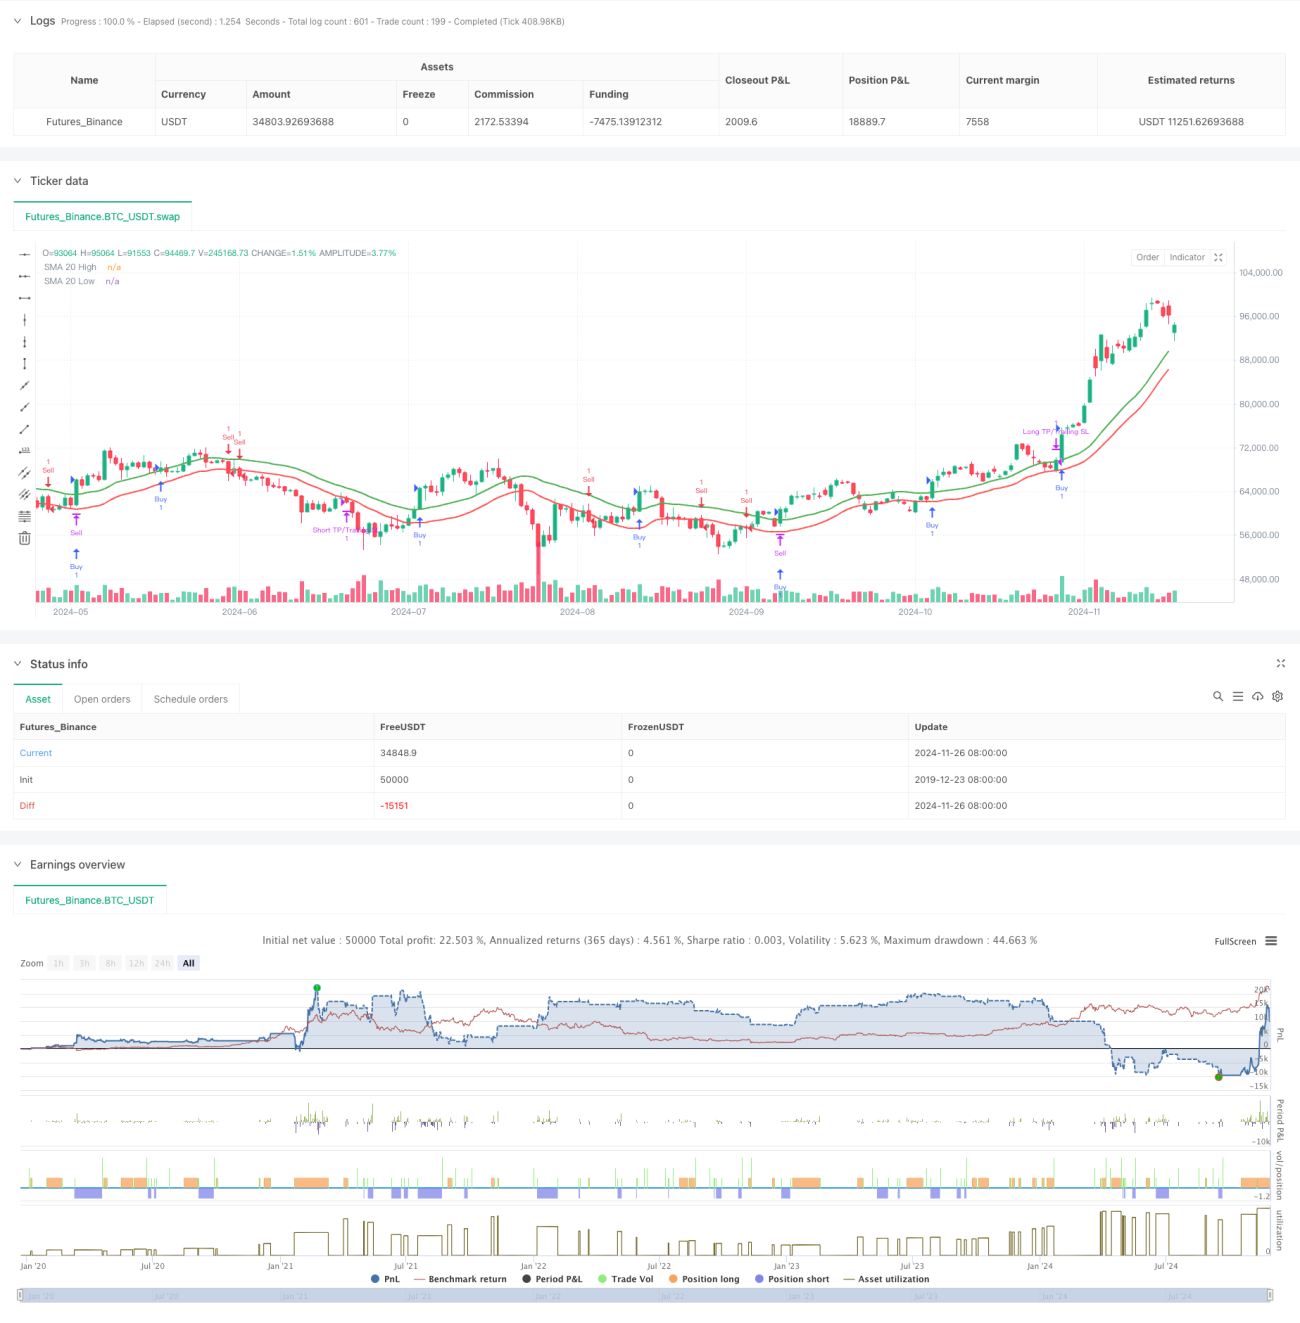
この戦略は,高点と低点の移動平均と斜率指標を計算することによって市場トレンドを識別し,ダイナミックな止損停止メカニズムと組み合わせてリスク管理を行う,二重均等線に基づくスマートトレンド追跡システムである.戦略の核心は,斜率の<unk>値をフィルターして偽信号をフィルターすることであり,トレーリングストップのダイナミックな追跡方法を使用して利益をロックすることであり,トレンド追跡とリスク制御の有機的な組み合わせを実現する.
戦略原則
戦略は,二重均線システムを核心取引論理として採用し,最高価格と最低価格の順序で分別移動平均を計算する.価格が上方平均線を突破し,平均線斜率が顕著に上昇すると,システムは多信号を生成する.価格が下方平均線を突破し,平均線斜率が顕著に低下すると,システムは空信号を生成する.波動的な市場での頻繁な取引を避けるために,戦略は,斜率<unk>値の仕組みを導入し,線平均斜率の変化が設定された<unk>値を超えた場合にのみ,トレンドの有効性を確認する.リスクの管理に関して,戦略は,ダイナミックなストップ・ロストの仕組みを設計し,当初,比較的激進的なストップ・ロストを設定し,同時に,ストップ・ロスト保護を使用して,既得した利益を追跡する.
戦略的優位性
- トレンド認識の高精度:双均線と斜率の<unk>値の組み合わせにより,横盤振動中の偽信号を効果的にフィルターします.
- リスク管理の改善: 動的ストップ・ローズ・メカニズムは,価格の変動に合わせて自動的に調整され,利潤を保護し,トレンドに十分な余地を与える
- パラメータの柔軟性: 戦略の重要なパラメータである平均線周期,ストップ・ストップ・スローズ比率,傾斜<unk>値などのパラメータは,異なる市場特性に合わせて柔軟に調整できます.
- 論理が明確でシンプル: 戦略の論理は直感的で,維持と最適化が容易である
- 適応性:異なる時間周期および取引品種に適用できる
戦略リスク
- トレンドの逆転リスク: トレンドが突然逆転した場合は,トレイリングストップで全利益をタイムリーにロックすることができません.
- パラメタセンシビリティ: パラメタ設定に対して戦略のパフォーマンスが敏感であり,異なる市場環境では異なるパラメタコンポジションが必要になる
- 波動市場: 傾斜フィルターがあるにもかかわらず,波動の激しい市場では偽信号が生じる可能性があります.
- スライドポイントの影響: 波動が激しい時期には,実際の取引価格とシグナル価格との大きな偏差がある可能性があります
戦略最適化の方向性
- 波動率自調メカニズムを導入:ATRの動向に応じて傾斜<unk>値と止損距離の調整を考慮する
- 市場環境のフィルターを増やす:トレンドの強さの指標を追加し,異なる市場環境で異なるパラメータの組み合わせを使用する
- ストップ・ロスの最適化: 多層のストップ・目標を設計し,利益の一部を段階的にロックする
- 取引量分析の追加:取引量データを統合してトレンドの検証の有効性
- タイムフィルター導入:市場の波動性のある時間帯での取引を避ける
要約する
これは,トレンド追跡とリスク管理を有機的に組み合わせた量化取引戦略である.双均線システムと斜率の<unk>値の組み合わせにより,戦略は市場傾向をより正確に捉えることができ,ダイナミックなストップ・ストップ・ロスの仕組みは,完全なリスク制御を提供します.戦略は,パラメータ選択と市場適応性に関して改善の余地があるが,明確な論理的枠組みと柔軟なシステムによるパラメータの後の最適化には良い基礎を提供します.
Source
Pine
Strategy parameters
Related strategies
Comment
All comments (0)
No data
- 1