概要
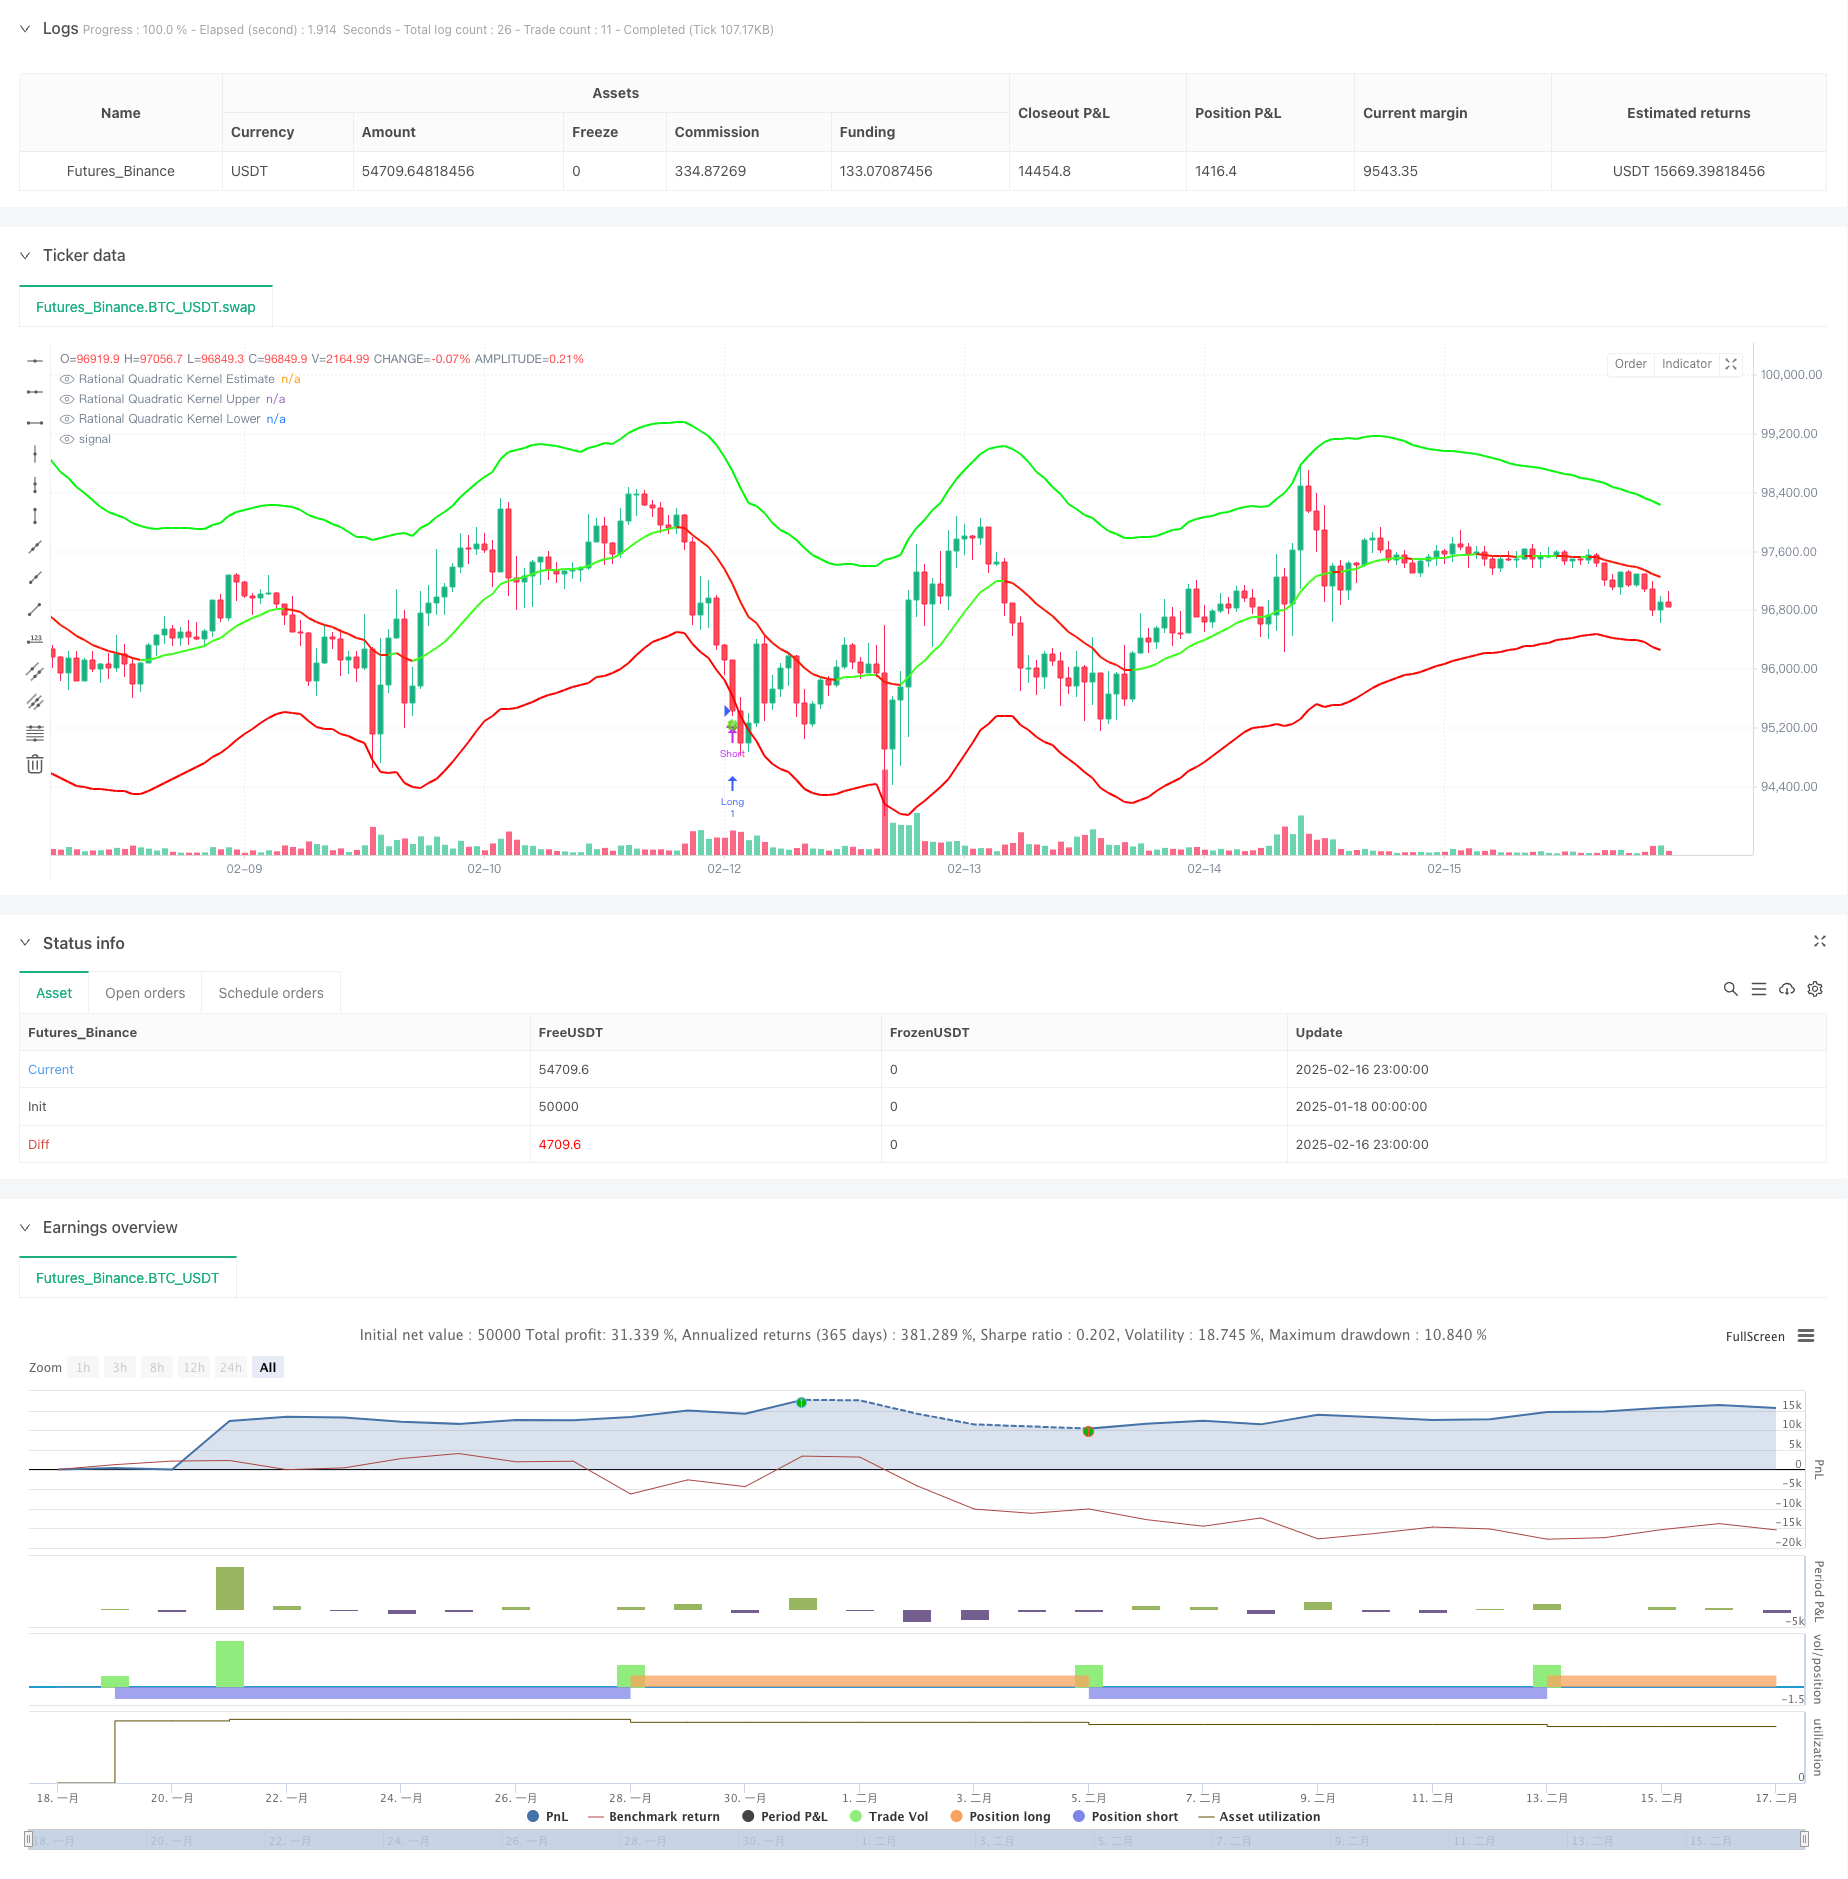
この戦略は,ナダラヤ-ワトソン・コア・リグレーションとATRダイナミック波段を組み合わせた自己適応トレンド追跡システムである.これは,合理的な二次コア関数によって価格トレンドを予測し,ATRベースのダイナミックなサポートと抵抗を活用して取引機会を識別する.システムは,構成可能なリグレーションウィンドウと重量パラメータによって市場の正確なモデリングを実現する.
戦略原則
策略の核心は,Nadaraya-Watson方法に基づく非参数核帰帰帰であり,合理二次核関数を使用して価格序列を平滑に処理する.帰帰は設定された初期バーから計算され,lookback window ((h) と相対重量 (® の2つの鍵パラメータによってフィット程度を制御する.同時にATR指標を組み合わせて,上下帯をそれぞれ帰帰推定値加減ATRの倍数として構成するダイナミック波段を構成する.システムは,波段と価格の交差によって取引シグナルを誘発する - 価格が下帯を突破すると多し,突破すると空きをする.トレンド判断は,価格の変動率や交差メカニズムに基づいて行われ,色彩変化によって直観的に表示される.
戦略的優位性
- 核回帰の方法は,価格の傾向を過度に適合せずに効果的に捉えるための優れた数学的基礎を持っています.
- ダイナミック波段は,市場の変動に自律的に調整され,より合理的なサポート抵抗点を提供します.
- パラメータは,異なる市場特性に合わせて柔軟に調整できます.
- トレンド認識の仕組みは柔軟で,スムーズまたは敏感なモードを選択できます.
- 視覚効果は直感的で,取引信号は明確です.
戦略リスク
- パラメータの不適切な選択は,オーバーフィットまたは遅滞を引き起こす可能性があります.
- 市場が揺れ動いている中で,過剰な取引信号が発生する可能性があります.
- ATR倍数設定が不適切で,止損が幅広く,または狭くなりかねない
- トレンド転換期に誤信号が出る可能性 歴史回帰で最適化パラメータを推奨し,他の指標と組み合わせて補助的な確認を行います.
戦略最適化の方向性
- トレンド確認として取引量指標の導入
- 適応パラメータ最適化メカニズムの開発
- トレンド強度フィルタを増加させ,虚偽信号を減少させる
- ストップ・ロスト・メカニズムの最適化による利益率の向上
- 市場環境の分類を考慮し,異なる市場で異なるパラメータを使用する
要約する
この戦略は,統計学的な学習方法と技術分析を組み合わせて,理論的な基礎がしっかりした実用的な取引システムを構築している.その自在な特性と構成性は,異なる市場環境に適応できるようにする.しかし,使用時にはパラメータ最適化とリスク管理に注意する必要がある.継続的な改善と最適化により,この戦略は,実際の取引において重要な役割を果たす見込みである.
ストラテジーソースコード
/*backtest
start: 2025-01-18 00:00:00
end: 2025-02-17 00:00:00
period: 1h
basePeriod: 1h
exchanges: [{"eid":"Futures_Binance","currency":"BTC_USDT"}]
*/

// This source code is subject to the terms of the Mozilla Public License 2.0 at https://mozilla.org/MPL/2.0/
// © Lupown

//@version=5
strategy("Nadaraya-Watson non repainting Strategy", overlay=true)  // PARAMETER timeframe ODSTRÁNENÝ

//--------------------------------------------------------------------------------
// INPUTS
//--------------------------------------------------------------------------------
src = input.source(close, 'Source')
h   = input.float(8., 'Lookback Window', minval=3., tooltip='The number of bars used for the estimation. This is a sliding value that represents the most recent historical bars. Recommended range: 3-50')
r   = input.float(8., 'Relative Weighting', step=0.25, tooltip='Relative weighting of time frames. As this value approaches zero, the longer time frames will exert more influence on the estimation. As this value approaches infinity, the behavior of the Rational Quadratic Kernel will become identical to the Gaussian kernel. Recommended range: 0.25-25')
x_0 = input.int(25, "Start Regression at Bar", tooltip='Bar index on which to start regression. The first bars of a chart are often highly volatile, and omission of these initial bars often leads to a better overall fit. Recommended range: 5-25')
showMiddle    = input.bool(true, "Show middle band")
smoothColors  = input.bool(false, "Smooth Colors", tooltip="Uses a crossover based mechanism to determine colors. This often results in less color transitions overall.", inline='1', group='Colors')
lag           = input.int(2, "Lag", tooltip="Lag for crossover detection. Lower values result in earlier crossovers. Recommended range: 1-2", inline='1', group='Colors')

lenjeje = input.int(32, "ATR Period",    tooltip="Period to calculate upper and lower band", group='Bands')
coef    = input.float(2.7, "Multiplier", tooltip="Multiplier to calculate upper and lower band", group='Bands')

//--------------------------------------------------------------------------------
// ARRAYS & VARIABLES
//--------------------------------------------------------------------------------
float y1 = 0.0
float y2 = 0.0
srcArray = array.new<float>(0)
array.push(srcArray, src)
size = array.size(srcArray)

//--------------------------------------------------------------------------------
// KERNEL REGRESSION FUNCTIONS
//--------------------------------------------------------------------------------
kernel_regression1(_src, _size, _h) =>
    float _currentWeight = 0.
    float _cumulativeWeight = 0.
    for i = 0 to _size + x_0
        y = _src[i]
        w = math.pow(1 + (math.pow(i, 2) / ((math.pow(_h, 2) * 2 * r))), -r)
        _currentWeight    += y * w
        _cumulativeWeight += w
    [_currentWeight, _cumulativeWeight]

[currentWeight1, cumulativeWeight1] = kernel_regression1(src, size, h)
yhat1 = currentWeight1 / cumulativeWeight1

[currentWeight2, cumulativeWeight2] = kernel_regression1(src, size, h - lag)
yhat2 = currentWeight2 / cumulativeWeight2

//--------------------------------------------------------------------------------
// TREND & COLOR DETECTION
//--------------------------------------------------------------------------------
// Rate-of-change-based
bool wasBearish   = yhat1[2] > yhat1[1]
bool wasBullish   = yhat1[2] < yhat1[1]
bool isBearish    = yhat1[1] > yhat1
bool isBullish    = yhat1[1] < yhat1
bool isBearishChg = isBearish  and wasBullish
bool isBullishChg = isBullish  and wasBearish

// Crossover-based (for "smooth" color changes)
bool isBullishCross  = ta.crossover(yhat2, yhat1)
bool isBearishCross  = ta.crossunder(yhat2, yhat1)
bool isBullishSmooth = yhat2 > yhat1
bool isBearishSmooth = yhat2 < yhat1

color c_bullish    = input.color(#3AFF17, 'Bullish Color', group='Colors')
color c_bearish    = input.color(#FD1707, 'Bearish Color', group='Colors')

color colorByCross = isBullishSmooth ? c_bullish : c_bearish
color colorByRate  = isBullish       ? c_bullish : c_bearish
color plotColor    = smoothColors ? colorByCross : colorByRate

// Middle Estimate
plot(showMiddle ? yhat1 : na, "Rational Quadratic Kernel Estimate", color=plotColor, linewidth=2)

//--------------------------------------------------------------------------------
// UPPER / LOWER BANDS
//--------------------------------------------------------------------------------
upperjeje = yhat1 + coef * ta.atr(lenjeje)
lowerjeje = yhat1 - coef * ta.atr(lenjeje)

plotUpper = plot(upperjeje, "Rational Quadratic Kernel Upper", color=color.rgb(0, 247, 8), linewidth=2)
plotLower = plot(lowerjeje, "Rational Quadratic Kernel Lower", color=color.rgb(255, 0, 0), linewidth=2)

//--------------------------------------------------------------------------------
// SYMBOLS & ALERTS
//--------------------------------------------------------------------------------
plotchar(ta.crossover(close, upperjeje),  char="🥀", location=location.abovebar, size=size.tiny)
plotchar(ta.crossunder(close, lowerjeje), char="🍀", location=location.belowbar, size=size.tiny)

// Alerts for Color Changes (estimator)
alertcondition(smoothColors ? isBearishCross : isBearishChg, title="Bearish Color Change", message="Nadaraya-Watson: {{ticker}} ({{interval}}) turned Bearish ▼")
alertcondition(smoothColors ? isBullishCross : isBullishChg, title="Bullish Color Change", message="Nadaraya-Watson: {{ticker}} ({{interval}}) turned Bullish ▲")

// Alerts when price crosses upper and lower band
alertcondition(ta.crossunder(close, lowerjeje), title="Price close under lower band", message="Nadaraya-Watson: {{ticker}} ({{interval}}) crossed under lower band 🍀")
alertcondition(ta.crossover(close, upperjeje),  title="Price close above upper band", message="Nadaraya-Watson: {{ticker}} ({{interval}}) Crossed above upper band 🥀")

//--------------------------------------------------------------------------------
// STRATEGY LOGIC (EXAMPLE)
//--------------------------------------------------------------------------------
if ta.crossunder(close, lowerjeje)
    // zatvoriť short
    strategy.close("Short")
    // otvoriť long
    strategy.entry("Long", strategy.long)

if ta.crossover(close, upperjeje)
    // zatvoriť long
    strategy.close("Long")
    // otvoriť short
    strategy.entry("Short", strategy.short)