
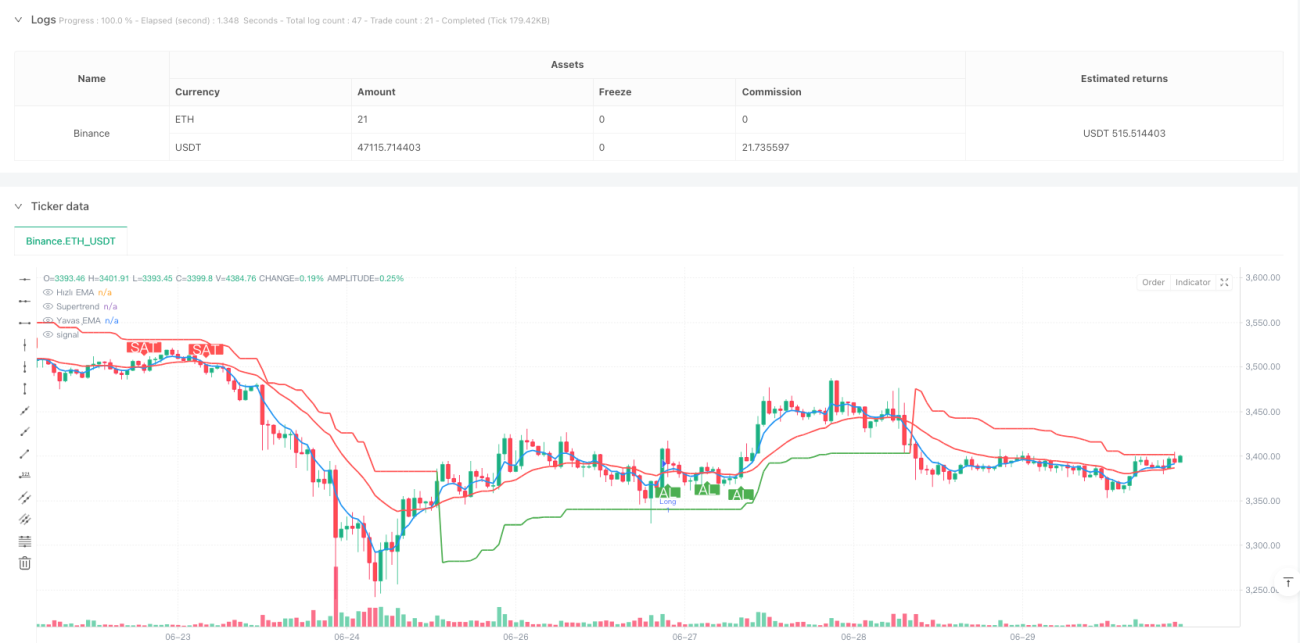
これは,双均線システム ((EMA5とEMA20) と超トレンド指標 ((Supertrend)) を組み合わせたトレンド追跡取引戦略である.この戦略は,高速移動平均と遅い移動平均の交差信号を組み合わせて,Supertrend指標が提供するトレンド方向の確認を組み合わせて,信頼性の高い取引システムを形成する.戦略設計は,トレンド確認と動量の変化の2つの重要な要因を十分に考慮し,二重検証機構によって取引の信号信頼性を向上させる.
戦略の核心的な論理は,以下の3つの重要な技術指標の組み合わせに基づいています.
買取シグナルには2つの条件があります.
売る信号は次の条件を満たす必要があります:
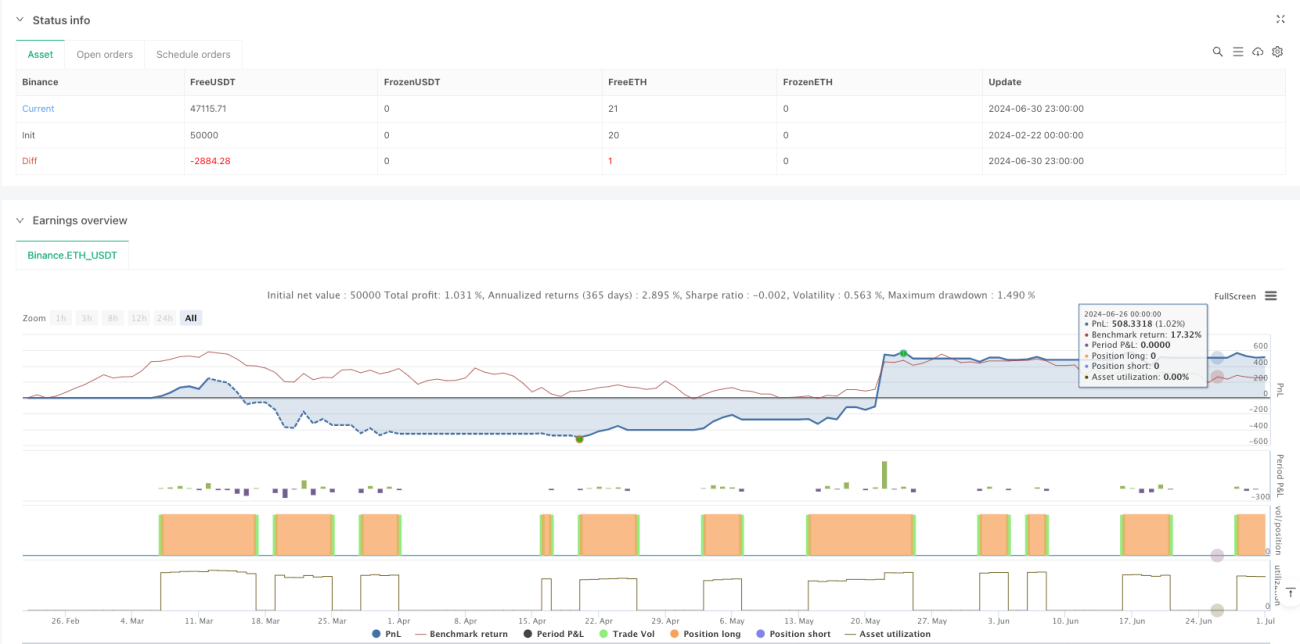
これは,構造が整った,論理が明確なトレンド追跡戦略である.均線システムとスーパートレンド指標を組み合わせることで,信号の正確性と遅滞性を効果的にバランスさせる.戦略の視覚的設計と情報表示システムは,トレーダーが市場の状態を迅速に判断するのを助ける.合理的なパラメータ最適化とリスク管理により,この戦略は,トレンド市場で良好な取引効果を得ることができる.
/*backtest
start: 2024-02-22 00:00:00
end: 2024-07-01 00:00:00
period: 1h
basePeriod: 1h
exchanges: [{"eid":"Binance","currency":"ETH_USDT"}]
*/
//@version=5
strategy("Advanced Supertrend + EMA Strategy", overlay=true)
// =================== PARAMETER INPUTS ===================
// EMA Parameters
emaFastLength = input.int(5, "Fast EMA", minval=1, maxval=50, group="EMA Settings")
emaSlowLength = input.int(20, "Slow EMA", minval=1, maxval=100, group="EMA Settings")
// Supertrend Parameters
atrPeriod = input.int(10, "ATR Period", minval=1, maxval=50, group="Supertrend Settings")
factor = input.float(3.0, "Factor", step=0.1, group="Supertrend Settings")
// =================== CALCULATIONS ===================
// EMA Calculations
emaFast = ta.ema(close, emaFastLength)
emaSlow = ta.ema(close, emaSlowLength)
// Supertrend Calculation
[supertrend, direction] = ta.supertrend(factor, atrPeriod)
// =================== SIGNAL GENERATION ===================
// EMA Crossovers
emaCrossUp = ta.crossover(emaFast, emaSlow)
emaCrossDown = ta.crossunder(emaFast, emaSlow)
// Supertrend Signals
stUp = direction < 0
stDown = direction > 0
// Buy and Sell Conditions
longCondition = emaCrossUp and stUp
shortCondition = emaCrossDown and stDown
// =================== GRAPHICAL INDICATORS ===================
// EMA Lines
plot(emaFast, color=color.new(color.blue, 0), linewidth=2, title="Fast EMA")
plot(emaSlow, color=color.new(color.red, 0), linewidth=2, title="Slow EMA")
// Supertrend Line
supertrendColor = direction < 0 ? color.green : color.red
plot(supertrend, color=supertrendColor, linewidth=2, title="Supertrend")
// Buy-Sell Signals
plotshape(longCondition, title="Buy", text="BUY", location=location.belowbar,
color=color.green, style=shape.labelup, size=size.normal, textcolor=color.white)
plotshape(shortCondition, title="Sell", text="SELL", location=location.abovebar,
color=color.red, style=shape.labeldown, size=size.normal, textcolor=color.white)
// =================== STRATEGY EXECUTIONS ===================
if (longCondition)
strategy.entry("Long", strategy.long)
if (shortCondition)
strategy.close("Long")
// =================== INFORMATION TABLE ===================
var table infoTable = table.new(position.bottom_right, 2, 4, bgcolor=color.new(color.black, 90))
// Signal Status
signalText = ""
signalColor = color.white
if (longCondition)
signalText := "BUY SIGNAL"
signalColor := color.green
if (shortCondition)
signalText := "SELL SIGNAL"
signalColor := color.red
// Table Content
table.cell(infoTable, 0, 0, "CURRENT SIGNAL", bgcolor=color.new(color.blue, 90))
table.cell(infoTable, 1, 0, signalText, text_color=signalColor)
table.cell(infoTable, 0, 1, "EMA TREND")
table.cell(infoTable, 1, 1, emaFast > emaSlow ? "UP" : "DOWN",
text_color=emaFast > emaSlow ? color.green : color.red)
table.cell(infoTable, 0, 2, "SUPERTREND")
table.cell(infoTable, 1, 2, direction < 0 ? "UP" : "DOWN",
text_color=direction < 0 ? color.green : color.red)
// Last Trade Information
table.cell(infoTable, 0, 3, "LAST TRADE")
table.cell(infoTable, 1, 3, longCondition ? "BUY" : shortCondition ? "SELL" : "-",
text_color=longCondition ? color.green : shortCondition ? color.red : color.white)