
概要
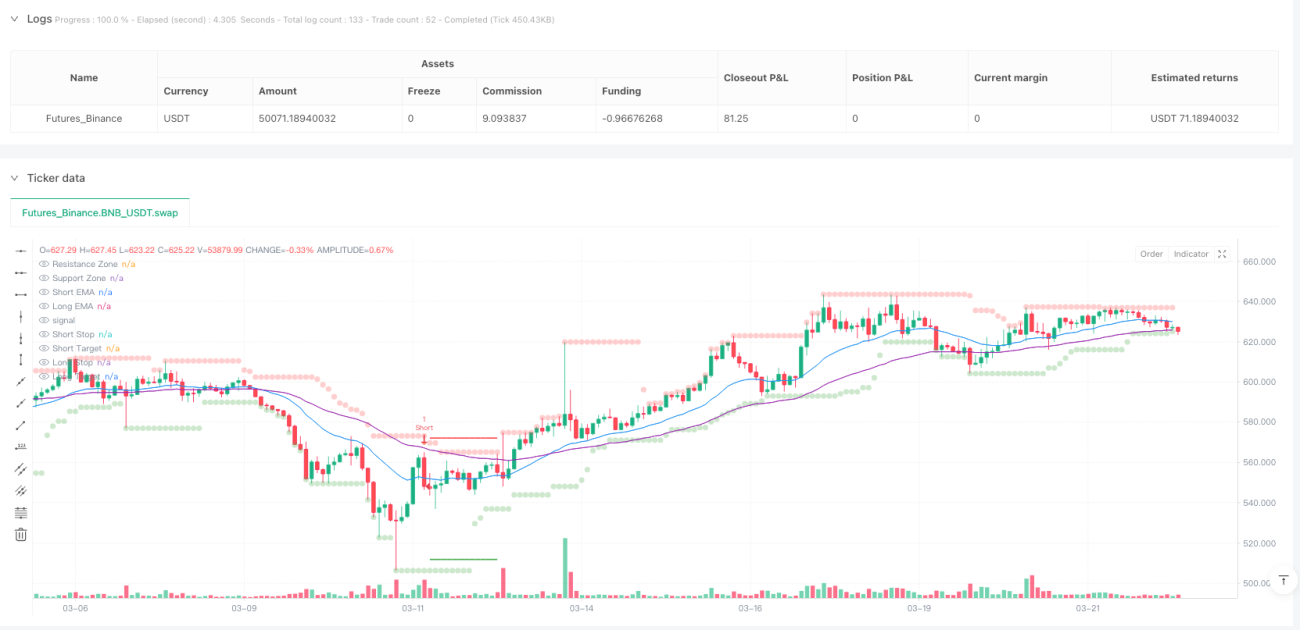
マルチファクタートレンドプライスアクション戦略と動的リスク管理システムは、複数の分析要素を組み合わせた定量取引戦略です。トレンド識別、プライスアクションパターン、出来高確認、ボラティリティ管理を統合し、確率の高い取引シグナルを生成します。本戦略は、二重指数移動平均線(EMA)クロスシステム、平均方向性指数(ADX)フィルター、サポート・レジスタンスの識別、公正価値ギャップ(FVG)検出、適応型ATR(真の平均範囲)ストップロス・利確メカニズムを採用し、包括的な取引判断フレームワークを提供します。
中核となる強みは、強シグナルと弱シグナルを区別する階層型シグナルシステムにあり、トレーダーはシグナルの強度に応じてポジションサイズを調整できます。トレンド方向、価格形状、出来高確認、市場のボラティリティを総合的に評価することで、柔軟性を保ちながらシステム化された取引ルールを提供します。
戦略の原理
本戦略は、トレンド識別、プライスアクションシグナル、出来高検証、リスク管理の4つの主要コンポーネントが連携して機能します。
-
トレンド識別システム:
- 短期EMA(デフォルト20期間)と長期EMA(デフォルト50期間)のクロスでトレンド方向を判断
- ADXインジケーター(デフォルト14期間)を使用し、ADX値が20より大きい場合にトレンド市場を識別
- 短期EMAが長期EMAより上にある場合は上昇トレンド、逆の場合は下降トレンドと確認
-
プライスアクションシグナル:
- 包み足(強気/弱気)を潜在的な反転シグナルとして検出
- ハンマー/逆ハンマーパターンを認識し、トレンド方向との整合性を検証
- 公正価値ギャップ(FVG)を追跡し、その埋め状況を監視、埋めウィンドウは5本のローソク足に設定
-
出来高検証:
- 現在の出来高が出来高移動平均線の1.5倍より大きいことを要求
- 前のローソク足の出来高がその移動平均線の1.2倍より大きいことを要求
- 出来高ピークとプライスアクションを組み合わせてシグナルの有効性を確認
-
リスク管理メカニズム:
- 14期間のATRを使用して動的ストップロスと利確水準を計算
- ストップロス距離はATR値の2倍に設定
- 利確距離はATR値の3倍に設定し、1:1.5のリスクリワード比を確立
戦略の中核はシグナルの優先順位システムにあります。強いシグナルはFVG+包み足+出来高+トレンドのすべての条件を同時に満たす必要があり、弱いシグナルはパターン+出来高+サポート/レジスタンスブレイクのみが必要です。この階層的アプローチにより、最も確信度が高い場合にのみ最大ポジションを使用できます。
戦略の強み
-
多要素確認メカニズム:
- 複数のテクニカル指標の同時確認を要求することで、偽シグナルを大幅に削減
- トレンド、パターン、出来高、ボラティリティの総合分析でシグナル品質を向上
- 階層型シグナルシステムにより、確認強度に応じてポジションを柔軟に調整
-
適応型リスク管理:
- ATRベースの動的ストップロス・利確が市場の実際のボラティリティに応じて自動調整
- 異なる市場条件下での差別化リスク管理(強/弱シグナルで異なる閾値を使用)
- 事前設定されたリスクリワード比が長期的な安定性を確保
-
再計算なしのサポート・レジスタンス:
- 確定した過去のピボットポイントを使用してサポート・レジスタンスゾーンを計算し、一般的な再計算問題を回避
- サポート・レジスタンスゾーンの可視化により判断が直感的に
-
適応型公正価値ギャップ(FVG)追跡:
- 価格ギャップをスマートに検出し、その埋め状況を監視
- 5本ローソク足のギャップ埋め期限切れメカニズムにより旧シグナルの干渉を防止
-
高度なカスタマイズ性:
- 複数のユーザー調整可能パラメータを提供し、異なる市場や時間枠に適応
- モジュール設計により各コンポーネント(トレンド、サポート/レジスタンス、FVG、出来高)を個別最適化可能
-
視覚的な判断支援:
- シグナルは異なる色とサイズで強度を区別
- ストップロス・利確水準をリアルタイム表示しリスク意識を強化
戦略のリスク
-
パラメータ感度:
- 多数のパラメータ設定によりオーバーフィッティングリスクが増加
- 市場条件によっては頻繁なパラメータ調整が必要
- 解決策:複数の市場タイプに対応したパラメータプリセットを構築し、包括的なバックテスト検証を実施
-
多条件フィルタリングの限界:
- 厳格な多条件フィルタリングにより取引機会が減少する可能性
- 高水準のエントリー条件は有効だが完全ではない取引機会を逃す可能性
- 解決策:中強度シグナルカテゴリーの追加や市場ボラティリティに応じた条件厳格度の調整を検討
-
移動平均線の遅延性:
- EMAクロスシステムには固有の遅延が存在し、トレンド初期段階を見逃す可能性
- 解決策:プライスアクションやサポート・レジスタンスブレイクを組み合わせて潜在的なトレンド転換を早期に識別
-
ATRストップロスの固定乗数の問題:
- 固定されたATR乗数は極端なボラティリティ市場では柔軟性に欠ける
- 解決策:適応型乗数システムを実装し、市場ボラティリティに応じて動的に調整
-
出来高依存の制限:
- 一部の市場や時間帯では出来高データが信頼できない、または意味が乏しい場合がある
- 解決策:RSIやMACD確認などの代替検証方法をオプションで提供
-
市場状態適応性の欠如:
- 現在の戦略はトレンド相場で優れたパフォーマンスを発揮するが、レンジ相場では効果が低い可能性
- 解決策:市場状態検出モジュールを追加し、レンジ相場では異なる取引ルールを使用
戦略の最適化方向
-
市場状態適応システム:
- 異なる市場状態(トレンド、レンジ、高ボラティリティ)を自動検出するメカニズムを実装
- 検出された市場状態に応じて戦略パラメータやシグナル閾値を動的に調整
- これにより、異なる市場環境下での戦略の安定性が大幅に向上
-
複数時間枠の統合:
- 上位時間枠のトレンドフィルター機能を追加
- 下位時間枠のエントリーと上位時間枠のトレンド方向の一致チェックを実装
- これにより大きなトレンドに逆らう取引を回避し、全体の勝率を向上
-
動的ストップロス管理:
- トレーリングストップロス機能を実装し、トレンド進行中に利益を確保
- 市場ボラティリティと価格動向に応じてATR乗数を自動調整
- 資金を保護しつつ有利な相場での利益を最大化
-
再エントリーメカニズムの最適化:
- スマート再エントリーアルゴリズムを開発し、強いトレンドではポジション追加を許可
- 傾斜型ポジション管理システムを設計し、シグナル強度と市場確認度に応じてポジションサイズを調整
- 強いトレンド相場での資金活用効率を向上
-
機械学習による強化:
- 簡易な機械学習アルゴリズムを統合してパラメータの組み合わせを動的最適化
- 過去データを使用して最適なパラメータ設定を識別するモデルを訓練
- 人為的介入を減らし、戦略の適応能力を向上
-
感情指標の統合:
- VIXや恐怖・貪欲指数などの市場感情指標を追加フィルターとして導入
- 極端な市場感情条件下でシグナル閾値を調整
- 市場の極端な状況での誤シグナルを回避
まとめ
マルチファクタートレンドプライスアクション戦略と動的リスク管理システムは、複数の市場分析技術を統合して高確率の取引機会を提供する包括的なテクニカル分析取引アプローチを表しています。本戦略の中核となる強みは、厳格な多要素確認メカニズム、適応型リスク管理システム、階層型シグナル優先順位アーキテクチャにあります。
トレンド識別(EMAクロスとADXフィルター)、プライスアクション分析(包み足とFVG)、出来高確認、動的ATRリスク管理を組み合わせることで、システム化を維持しつつ十分な柔軟性を提供します。モジュール設計により、トレーダーは異なる市場環境や個人のリスク選好に応じて調整できます。
本戦略は多重検証メカニズムにより偽シグナルを減らせますが、多パラメータシステムによるオーバーフィッティングリスクや、厳格な条件による取引機会減少には注意が必要です。今後の最適化方向は、市場状態適応、複数時間枠統合、動的リスク管理機能に焦点を当て、異なる市場環境でのパフォーマンスをさらに向上させるべきです。
全体として、本戦略はテクニカル分析の複数の次元をバランスさせ、合理的なリスクを維持しながら一貫した収益を追求する構造化された取引フレームワークを提供します。テクニカル分析を理解し、システム化された取引方法を求めるトレーダーにとって、検討に値する戦略テンプレートです。
- 1