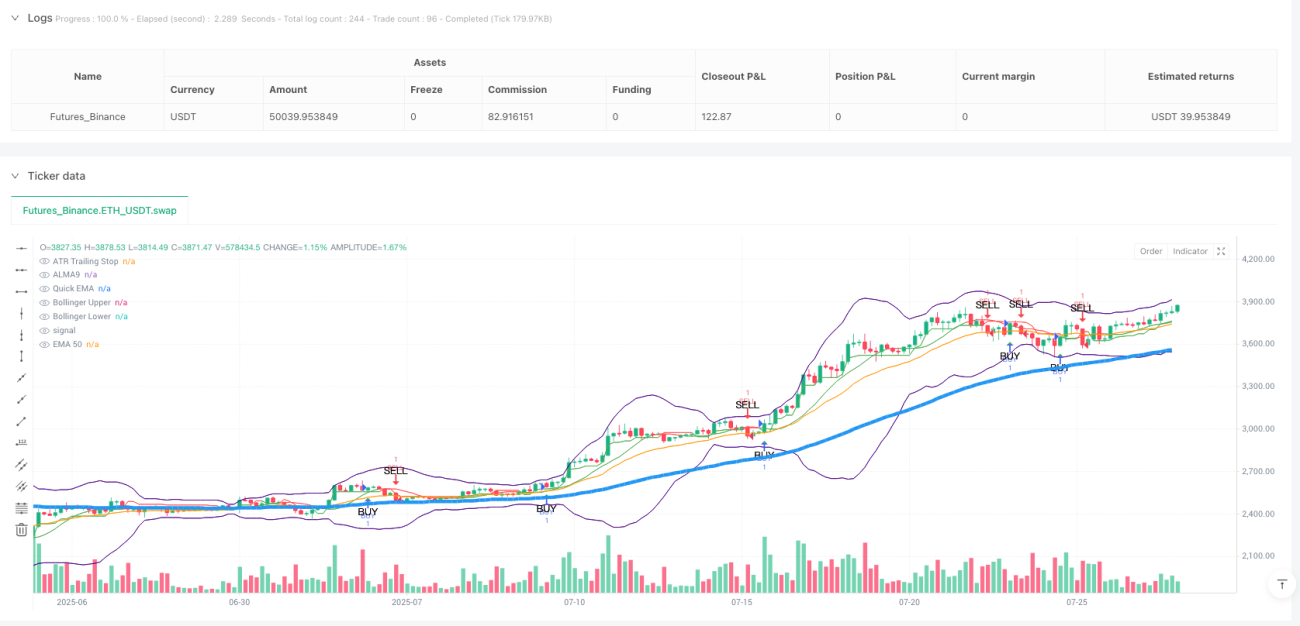
マルチファクターALMA-ATR自己適応トレンドトラッキング戦略は,入場と出場のタイミングを最適化するために複数の技術指標を組み合わせた総合的な取引システムである.この戦略の核心は,ALMA (Arnaud Legoux移動平均) を主要なトレンド判断ツールとして使用し,ATRの波動率フィルタリング,RSIの動量確認,ADXのトレンド強さの検証,ブリン帯の波動率制御機構を統合している.この戦略は,UT Botシステム,ATRベースのトラッキング・ストップ・ロスとシグナルシステムも統合している.
この戦略の核心原則は,複数の技術指標の協同作用によって,トレンドが明確で波動率が適度であることを保証した条件で取引することです.具体的には:
戦略は,ダイナミックなリスク管理方法を採用し,ストップとストップ・ストップのレベルはATR計算に基づいています.これは,戦略が異なる市場条件下での変動の変化に適応できるようにします.
この戦略には以下の利点があります.
この戦略は設計上上は良好ですが,以下のリスクがあります.
戦略の分析に基づいて,以下の最適化方向が提案されています.
これらの最適化方向の目的は,戦略の安定性を高め,後退を軽減し,異なる市場環境で一貫したパフォーマンスを維持することです.
マルチファクターALMA-ATR自己適応トレンドトラッキング戦略は,総合的な強度,リスク制御の完善な取引システムである.ALMA,ATR,RSI,ADX,ブリンバンド,UT Botなどの複数の技術ツールを統合することにより,この戦略は,トレンドを効果的に識別し,ノイズをフィルターし,リスクを制御し,適切なタイミングで入場および出場する.戦略の核心的な優点は,複数の確認機構と自己適応のリスク管理システムであり,これは,異なる市場環境で安定したパフォーマンスを維持できるようにする.
それにもかかわらず,いかなる取引戦略も市場の不確実性によってもたらされる課題に直面しています.パラメータの設定を継続的に最適化し,市場状態の分類を導入し,マルチタイムフレーム分析を統合するなどの方法によって,この戦略にはまだ大きな改善の余地があります.
/*backtest
start: 2024-07-30 00:00:00
end: 2025-07-28 08:00:00
period: 4h
basePeriod: 4h
exchanges: [{"eid":"Futures_Binance","currency":"ETH_USDT"}]
*/
// This Pine Script™ code is subject to the terms of the Mozilla Public License 2.0 at https://mozilla.org/MPL/2.0/
// © blntduman
//@version=5
strategy(title="ALMA Optimized Strategy - Volatilite Filtresi + UT Bot", overlay=true)
// USER INPUTS
fast_ema_length = input.int(20, title="Hızlı EMA Length", minval=5, maxval=40)
atr_length = input(14, title="ATR Length")
ema_length = input(72, title="EMA Length")
adx_length = input.int(10, title="ADX Length")
rsi_length = input(14, title="RSI Length")
rsi_overbought = 70
rsi_oversold = 30
cooldown_bars = input.int(7, title="Cooldown Bars (Same Signal Block)", minval=1)
bb_mult = input.float(3.0, title="Bollinger Band Multiplier")
sl_atr_mult = input.float(5.0, title="Stop Loss Multiplier", minval=0.1)
tp_atr_mult = input.float(4.0, title="Take Profit Multiplier", minval=0.1)
time_based_exit = input.int(0, title="Time Based Exit (Bars)", minval=0) // 0 is disabled
min_atr = input.float(0.005, title="Minimum ATR", minval=0.0001) // Minimum ATR value
// Quick EMA Calculation
fast_ema = ta.ema(close, fast_ema_length)
plot(fast_ema, title="Quick EMA", color=color.orange)
// ALMA9 Calculation
alma9 = ta.alma(close, 15, 0.65, 6)
var color almaColor1 = na
almaColor1 := close > alma9 ? color.green : color.red
plot(alma9, title="ALMA9", color=almaColor1)
// EMA 50 Calculation
ema50 = ta.ema(close, ema_length)
plot(ema50, "EMA 50", color=color.blue, linewidth=5)
// ADX Calculation
[_, _, adx] = ta.dmi(adx_length, 14)
// RSI Calculation
rsi = ta.rsi(close, rsi_length)
// ATR Based Stop-Loss and Take-Profit
atr = ta.atr(atr_length)
stop_loss = atr * sl_atr_mult
profit_target = atr * tp_atr_mult
// Bollinger Bands
bb_basis = ta.sma(close, 20)
bb_dev = bb_mult * ta.stdev(close, 20)
bb_upper = bb_basis + bb_dev
bb_lower = bb_basis - bb_dev
plot(bb_upper, "Bollinger Upper", color=#4f0489)
plot(bb_lower, "Bollinger Lower", color=#4f0489)
//Variables to follow the previous signal
var int last_buy_bar = na
var int last_sell_bar = na
var int entry_bar_index = na
var string last_signal = ""
// Volatilite Filter
volatilite_filtresi = atr > min_atr
// BUY Conditions
buy_condition = volatilite_filtresi and close > ema50 and (close > alma9 ) and rsi > rsi_oversold and rsi > 30 and adx > 30 and close < bb_upper and (na(last_buy_bar) or bar_index - last_buy_bar > cooldown_bars) and (last_signal != "BUY")
// SELL Conditions
sell_condition = volatilite_filtresi and ta.crossunder(close, fast_ema) and (last_signal != "SELL")
if (buy_condition)
strategy.entry("BUY", strategy.long)
last_buy_bar := bar_index
entry_bar_index := bar_index
last_signal := "BUY"
if (sell_condition)
strategy.close("BUY")
strategy.entry("SELL", strategy.short)
last_sell_bar := bar_index
last_signal := "SELL"
// Exit Strategy
if time_based_exit > 0
strategy.exit("BUY_EXIT", from_entry="BUY", loss=stop_loss, profit=profit_target, when=bar_index - entry_bar_index >= time_based_exit)
else
strategy.exit("BUY_EXIT", from_entry="BUY", loss=stop_loss, profit=profit_target)
strategy.exit("SELL_EXIT", from_entry="SELL", loss=stop_loss, profit=profit_target)
// Sinyalleri Görselleştirme
plotshape(series=buy_condition, location=location.belowbar, color=color.green, style=shape.triangleup, size=size.small, title="BUY Signal", text="BUY", textcolor=#090000)
plotshape(series=sell_condition, location=location.abovebar, color=color.red, style=shape.triangledown, size=size.small, title="SELL Signal", text="SELL", textcolor=#090000)
//----------------------------------------------------------------------------
// UT Bot Inputları
//----------------------------------------------------------------------------
a = input.int(1, title = "UT Bot: Key Value. 'This changes the sensitivity'")
c = input.int(10, title = "UT Bot: ATR Period")
h = input.bool(false, title = "UT Bot: Signals from Heikin Ashi Candles")
//----------------------------------------------------------------------------
// UT Bot Calculation
//----------------------------------------------------------------------------
xATR = ta.atr(c)
nLoss = a * xATR
src = h ? request.security(syminfo.tickerid, timeframe.period, close, lookahead = barmerge.lookahead_on) : close
var float xATRTrailingStop = 0.0
xATRTrailingStop := if src > nz(xATRTrailingStop[1], 0) and src[1] > nz(xATRTrailingStop[1], 0)
math.max(nz(xATRTrailingStop[1]), src - nLoss)
else
if src < nz(xATRTrailingStop[1], 0) and src[1] < nz(xATRTrailingStop[1], 0)
math.min(nz(xATRTrailingStop[1]), src + nLoss)
else
if src > nz(xATRTrailingStop[1], 0)
src - nLoss
else
src + nLoss
var int pos = 0
pos := if src[1] < nz(xATRTrailingStop[1], 0) and src > nz(xATRTrailingStop[1], 0)
1
else
if src[1] > nz(xATRTrailingStop[1], 0) and src < nz(xATRTrailingStop[1], 0)
-1
else
nz(pos[1], 0)
xcolor = pos == -1 ? color.red : pos == 1 ? color.green : color.blue
ema_ut = ta.ema(src,1)
above = ta.crossover(ema_ut, xATRTrailingStop)
below = ta.crossunder(xATRTrailingStop, ema_ut)
buy_ut = src > xATRTrailingStop and above
sell_ut = src < xATRTrailingStop and below
barbuy = src > xATRTrailingStop
barsell = src < xATRTrailingStop
//----------------------------------------------------------------------------
// Alarms (UT Bot Tan)
//----------------------------------------------------------------------------
alertcondition(buy_ut, "UT Long", "UT Long")
alertcondition(sell_ut, "UT Short", "UT Short")
//----------------------------------------------------------------------------
// Plots (from UT Bot)
//----------------------------------------------------------------------------
// Making the UT Bot Alert Line Two-Color
linecolor = close > xATRTrailingStop ? color.green : color.red
plot(xATRTrailingStop, color=linecolor, title="ATR Trailing Stop")
// UT Bot Buy/Sell Articles
plotshape(series=buy_condition, location=location.belowbar, color=color.green, style=shape.triangleup, size=size.small, title="BUY Signal", text="BUY", textcolor=#090000)
plotshape(series=sell_condition, location=location.abovebar, color=color.red, style=shape.triangledown, size=size.small, title="SELL Signal", text="SELL", textcolor=#090000)