영구 계약 그리드 전략 매개 변수 최적화의 자세한 설명
저자:리디아, 창작: 2023-12-11 15:04:25, 업데이트: 2024-01-02 21:24:31
영구 격자 전략은 FMZ 플랫폼에서 인기있는 고전적인 전략입니다. 스팟 격자와 비교하면 통화가 필요 없으며 레버리지를 추가 할 수 있으며 이는 스팟 격자보다 훨씬 편리합니다. 그러나 FMZ 퀀트 플랫폼에서 직접 백테스트가 불가능하기 때문에 통화를 스크린하고 매개 변수 최적화를 결정하는 데 도움이되지 않습니다. 이 기사에서는 데이터 수집, 백테스트 프레임워크, 백테스트 기능, 매개 변수 최적화 등을 포함한 전체 파이썬 백테스팅 프로세스를 소개 할 것입니다. juypter 노트북에서 직접 시도 할 수 있습니다.
데이터 수집
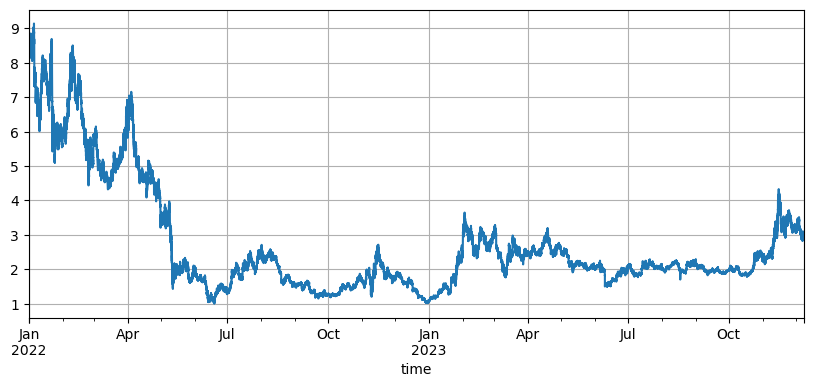
일반적으로, K-라인 데이터를 사용하는 것이 충분하다. 정확성을 위해, K-라인 기간이 작을수록 더 좋습니다. 그러나, 백테스트 시간과 데이터 볼륨을 균형 잡기 위해, 이 기사에서는 백테스트를 위해 지난 2 년 동안의 5min 데이터를 사용합니다. 최종 데이터 볼륨은 200,000 라인을 초과했습니다. 우리는 DYDX를 통화로 선택합니다. 물론, 특정 통화와 K-라인 기간은 자신의 관심사에 따라 선택할 수 있습니다.
import requests
from datetime import date,datetime
import time
import pandas as pd
import numpy as np
import matplotlib.pyplot as plt
import requests, zipfile, io
%matplotlib inline

def GetKlines(symbol='BTC',start='2020-8-10',end='2021-8-10',period='1h'):
    Klines = []
    start_time = int(time.mktime(datetime.strptime(start, "%Y-%m-%d").timetuple()))*1000
    end_time = int(time.mktime(datetime.strptime(end, "%Y-%m-%d").timetuple()))*1000
    while start_time < end_time:
        res = requests.get('https://fapi.binance.com/fapi/v1/klines?symbol=%sUSDT&interval=%s&startTime=%s&limit=1000'%(symbol,period,start_time))
        res_list = res.json()
        Klines += res_list
        start_time = res_list[-1][0]
    return pd.DataFrame(Klines,columns=['time','open','high','low','close','amount','end_time','volume','count','buy_amount','buy_volume','null']).astype('float')

df = GetKlines(symbol='DYDX',start='2022-1-1',end='2023-12-7',period='5m')
df = df.drop_duplicates()
백테스팅 프레임워크
백테스팅을 위해, 우리는 USDT 상시계약을 지원하는 일반적으로 사용되는 프레임워크를 계속 선택합니다.
class Exchange:

    def __init__(self, trade_symbols, fee=0.0004, initial_balance=10000):
        self.initial_balance = initial_balance #Initial assets
        self.fee = fee
        self.trade_symbols = trade_symbols
        self.account = {'USDT':{'realised_profit':0, 'unrealised_profit':0, 'total':initial_balance, 'fee':0}}
        for symbol in trade_symbols:
            self.account[symbol] = {'amount':0, 'hold_price':0, 'value':0, 'price':0, 'realised_profit':0,'unrealised_profit':0,'fee':0}

    def Trade(self, symbol, direction, price, amount):

        cover_amount = 0 if direction*self.account[symbol]['amount'] >=0 else min(abs(self.account[symbol]['amount']), amount)
        open_amount = amount - cover_amount
        self.account['USDT']['realised_profit'] -= price*amount*self.fee #Deduction of handling fee
        self.account['USDT']['fee'] += price*amount*self.fee
        self.account[symbol]['fee'] += price*amount*self.fee

        if cover_amount > 0: #Close the position first.
            self.account['USDT']['realised_profit'] += -direction*(price - self.account[symbol]['hold_price'])*cover_amount  #Profits
            self.account[symbol]['realised_profit'] += -direction*(price - self.account[symbol]['hold_price'])*cover_amount

            self.account[symbol]['amount'] -= -direction*cover_amount
            self.account[symbol]['hold_price'] = 0 if self.account[symbol]['amount'] == 0 else self.account[symbol]['hold_price']

        if open_amount > 0:
            total_cost = self.account[symbol]['hold_price']*direction*self.account[symbol]['amount'] + price*open_amount
            total_amount = direction*self.account[symbol]['amount']+open_amount

            self.account[symbol]['hold_price'] = total_cost/total_amount
            self.account[symbol]['amount'] += direction*open_amount


    def Buy(self, symbol, price, amount):
        self.Trade(symbol, 1, price, amount)

    def Sell(self, symbol, price, amount):
        self.Trade(symbol, -1, price, amount)

    def Update(self, close_price): #Updating of assets
        self.account['USDT']['unrealised_profit'] = 0
        for symbol in self.trade_symbols:
            self.account[symbol]['unrealised_profit'] = (close_price[symbol] - self.account[symbol]['hold_price'])*self.account[symbol]['amount']
            self.account[symbol]['price'] = close_price[symbol]
            self.account[symbol]['value'] = abs(self.account[symbol]['amount'])*close_price[symbol]
            self.account['USDT']['unrealised_profit'] += self.account[symbol]['unrealised_profit']
        self.account['USDT']['total'] = round(self.account['USDT']['realised_profit'] + self.initial_balance + self.account['USDT']['unrealised_profit'],6)
그리드 백테스트 함수
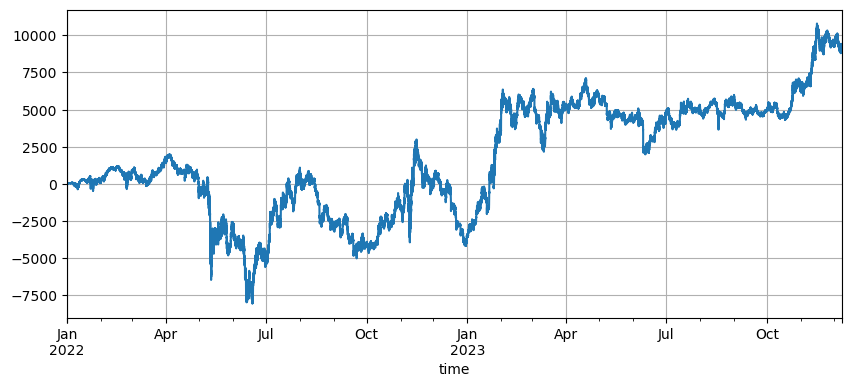
그리드 전략의 원리는 매우 간단하다. 가격이 상승할 때 판매하고 가격이 떨어질 때 구매한다. 특히 초기 가격, 그리드 간격 및 거래 가치라는 세 가지 매개 변수를 포함한다. DYDX 시장은 크게 변동한다. 초기 최저 8.6U에서 1U로 떨어졌고, 최근 황소 시장에서 다시 3U로 상승했다. 전략의 기본 초기 가격은 8.6U이며, 이는 그리드 전략에 매우 불리하지만 기본 매개 변수 백테스트로 2 년 동안 총 9200U의 이익이 발생했으며 기간 동안 7500U의 손실이 발생했다.
symbol = 'DYDX'
value = 100
pct = 0.01

def Grid(fee=0.0002, value=100, pct=0.01, init = df.close[0]):
    e = Exchange([symbol], fee=0.0002, initial_balance=10000)
    init_price = init
    res_list = [] #For storing intermediate results
    for row in df.iterrows():
        kline = row[1] #To backtest a K-line will only generate one buy order or one sell order, which is not particularly accurate.
        buy_price = (value / pct - value) / ((value / pct) / init_price + e.account[symbol]['amount']) #The buy order price, as it is a pending order transaction, is also the final aggregated price
        sell_price = (value / pct + value) / ((value / pct) / init_price + e.account[symbol]['amount'])
        if kline.low < buy_price: #The lowest price of the K-line is lower than the current pending order price, the buy order is filled
            e.Buy(symbol,buy_price,value/buy_price)
        if kline.high > sell_price:
            e.Sell(symbol,sell_price,value/sell_price)
        e.Update({symbol:kline.close})
        res_list.append([kline.time, kline.close, e.account[symbol]['amount'], e.account['USDT']['total']-e.initial_balance,e.account['USDT']['fee'] ])
    res = pd.DataFrame(data=res_list, columns=['time','price','amount','profit', 'fee'])
    res.index = pd.to_datetime(res.time,unit='ms')
    return res
초기 가격 영향
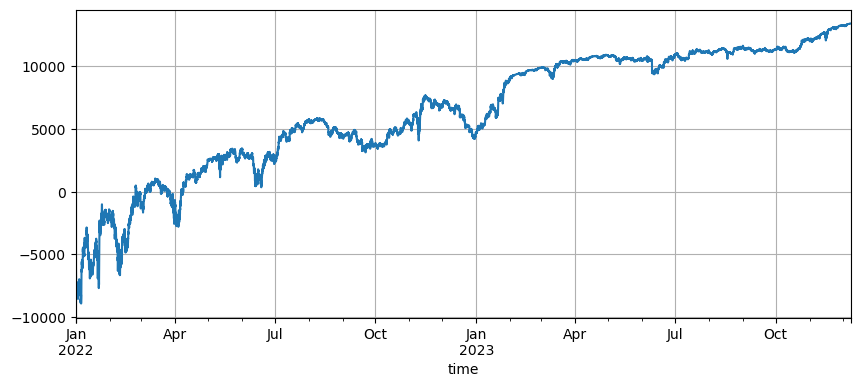
초기 가격의 설정은 전략의 초기 위치에 영향을 미칩니다. 지금 백테스트의 기본 초기 가격은 시작시의 초기 가격입니다. 즉, 시작시에는 포지션이 보유되지 않습니다. 그리고 우리는 그리드 전략이 가격이 초기 단계로 돌아갈 때 모든 수익을 실현한다는 것을 알고 있습니다. 따라서 전략이 출시 될 때 미래의 시장을 올바르게 예측할 수 있다면 수익이 크게 향상됩니다. 여기, 우리는 초기 가격을 3U로 설정하고 다시 백테스트합니다. 결국 최대 인하가 9200U이었고 최종 이익은 13372U였습니다. 최종 전략은 포지션을 보유하지 않습니다. 이윤은 모든 변동 이익이며 기본 매개 변수의 이익 사이의 차이는 최종 가격의 부정확한 판단으로 인한 위치 손실입니다.
그러나 초기 가격이 3U로 설정되면 전략은 초기에는 단위로 이동하여 많은 수의 단위 포지션을 보유합니다. 이 예제에서는 17,000 U의 단위 주문이 직접 보유되므로 더 큰 위험에 직면합니다.
그리드 간격 설정
그리드 간격은 미뤄진 주문 사이의 거리를 결정합니다. 분명히, 간격이 작을수록 거래가 더 자주, 단일 거래의 이익이 낮을수록 처리 수수료가 더 높습니다. 그러나, 그리드 간격이 작아지고 그리드 값이 변하지 않을 때, 가격 변화가 발생하면 총 포지션은 증가하고 직면한 위험은 완전히 다릅니다. 따라서 그리드 간격의 효과를 백테스트하려면 그리드 값을 변환해야합니다.
백테스트는 5m의 K-라인 데이터를 사용하고, 각 K-라인은 한 번만 거래되기 때문에, 특히 디지털 화폐의 변동성이 매우 높기 때문에 분명히 비현실적입니다. 라이브 거래에 비해 더 작은 간격은 백테스트에서 많은 거래를 놓칠 것입니다. 더 큰 간격만이 참조 값을 가질 것입니다. 이 백테스트 메커니즘에서 도출된 결론은 정확하지 않습니다. 틱 레벨 주문 흐름 데이터 백테스트를 통해 최적의 그리드 간격은 0.005-0.01이어야합니다.
for p in [0.0005, 0.001 ,0.002 ,0.005, 0.01, 0.02, 0.05]:
    res = Grid( fee=0.0002, value=value*p/0.01, pct=p, init =3)
    print(p, round(min(res['profit']),0), round(res['profit'][-1],0), round(res['fee'][-1],0))

0.0005 -8378.0 144.0 237.0
0.001 -9323.0 1031.0 465.0
0.002 -9306.0 3606.0 738.0
0.005 -9267.0 9457.0 781.0
0.01 -9228.0 13375.0 550.0
0.02 -9183.0 15212.0 309.0
0.05 -9037.0 16263.0 131.0
그리드 트랜잭션 값
앞서 언급했듯이 변동이 동일할수록 지분 가치가 커질수록 위험은 비례적이다. 그러나 급격한 하락이 없는 한 전체 자금의 1%와 그리드 간격의 1%가 대부분의 시장 조건에 대처할 수 있어야 한다. 이 DYDX 예제에서 거의 90%의 하락도 청산을 촉발했다. 그러나 DYDX가 주로 하락하는 것을 유의해야 한다. 그리드 전략이 하락할 때 길게 갈 때, 최대 100%로 하락할 것이고, 상승에 제한이 없으며 위험은 훨씬 높다. 따라서 그리드 전략은 사용자가 잠재력이 있다고 믿는 통화에 대한 긴 포지션 모드만을 선택하는 것을 권장한다.
- 양적 거래의 필수 도구 - 발명자 양적 데이터 탐색 모듈
- 모든 것을 마스터 - FMZ에 대한 소개 트레이딩 터미널의 새로운 버전 (TRB 중재 소스 코드)
- FMZ의 새로운 거래 단말기 소개 (TRB 리비트 소스 추가)
- FMZ 퀀트: 암호화폐 시장에서 공통 요구 사항 설계 예제 분석 (II)
- 80 줄의 코드에서 고주파 전략으로 뇌 없는 판매봇을 이용하는 방법
- FMZ 정량화: 암호화폐 시장의 일반적인 요구 디자인 사례 분석 (II)
- 80줄의 코드의 고주파 전략으로 뇌 없는 로봇을 파는 방법
- FMZ Quant: 암호화폐 시장에서 공통 요구 사항 디자인 예의 분석 (I)
- FMZ 정량화: 암호화폐 시장의 일반적인 요구 디자인 사례 분석 (1)
- FMZ 퀀트 암호화폐 데모 거래소 WexApp가 새로 출시되었습니다.
- 보트의 매개 변수를 배치 수정 하려면 FMZ 확장 API를 사용 하는 법을 가르쳐
- FMZ 확장 API를 사용하여 대량으로 디스크 변수를 변경하는 방법을 알려줍니다.
- 영구 계약 격자 전략 매개 변수 최적화 세부 사항
- 리눅스 바시에서 인터랙티브 브로커 IB 게이트웨이를 설치하는 지침
- 리눅스 바시에서 설치 침투보증 IB GATEWAY 설명
- 바닥 낚시, 낮은 시장 가치 또는 낮은 가격에 더 적합한?
- 저시장 가치와 낮은 가격, 어떤 것이 더 적합합니까?
- 베이어스 - 확률 의 신비 를 해명 하고 의사결정 의 배후 에 있는 수학적 지혜 를 탐구
- 베이어스: 확률을 해독하는 비밀, 결정의 수학적인 지혜를 탐구하는 것
- 양적 거래에서 효율적인 그룹 제어 관리를 위해 FMZ의 확장 API를 사용하는 것의 장점