

성숙한 분류기: 서포트 벡터 머신(SVM)은 강력하고 성숙한 이진(또는 다변량) 분류 알고리즘입니다. 주가가 상승할지 하락할지 예측하는 것은 전형적인 이진 분류 문제입니다.
비선형 기능: SVM은 커널 함수(예: RBF 커널)를 사용하여 금융 시장 데이터에 필수적인 입력 기능 간의 복잡한 비선형 관계를 포착할 수 있습니다.
특징 기반: 모델의 효과는 모델에 입력하는 "특징"에 크게 좌우됩니다. 지금 계산된 알파 계수는 좋은 시작이며, 예측력을 향상시키기 위해 이러한 특징을 더 많이 구축할 수 있습니다.
이번에는 3가지 기능 개요로 시작했습니다.
1: 고주파 주문 흐름 특성:
alpha_1min: 지난 1분 동안의 모든 틱을 기반으로 계산된 주문 흐름 불균형 요소입니다.
alpha_5min: 지난 5분 동안의 모든 틱을 기반으로 계산된 주문 흐름 불균형 요소입니다.
alpha_15min: 지난 15분 동안의 모든 틱을 기반으로 계산된 주문 흐름 불균형 요소입니다.
ofi_1min (주문 흐름 불균형): 1분 동안의 (매수량/매도량) 비율입니다. 알파보다 더 직접적입니다.
vol_per_trade_1min: 1분 내 거래당 평균 거래량. 시장에 영향을 미치는 대량 주문의 징후입니다.
2: 가격 및 변동성 특성:
log_return_5min: 지난 5분 동안의 대수적 반환율, log(P_t / P_{t-5min}).
volatility_15min: 지난 15분 동안의 로그 수익률의 표준 편차로, 단기 변동성을 측정합니다.
atr_14(ATR): 과거 14개의 1분 캔들스틱을 기반으로 한 ATR 값으로, 고전적인 변동성 지표입니다.
rsi_14(상대 강도 지수): 이는 지난 14개 1분 캔들스틱의 RSI 값을 기반으로 매수 과다 및 매도 과다 상태를 측정한 것입니다.
3: 시간 특성:
hour_of_day: 현재 시간(0-23). 시장은 시간대에 따라 다르게 움직입니다(예: 아시아/유럽/미국 세션).
day_of_week: 요일(0~6). 주말과 평일의 변동 패턴이 다릅니다.
def calculate_features_and_labels(klines):
"""
核心函数
"""
features = []
labels = []
# 为了计算RSI等指标,我们需要价格序列
close_prices = [k['close'] for k in klines]
# 从第30根K线开始,因为需要足够的前置数据
for i in range(30, len(klines) - PREDICT_HORIZON):
# 1. 价格与波动率特征
price_change_15m = (klines[i]['close'] - klines[i-15]['close']) / klines[i-15]['close']
volatility_30m = np.std(close_prices[i-30:i])
# 计算RSI
diffs = np.diff(close_prices[i-14:i+1])
gains = np.sum(diffs[diffs > 0]) / 14
losses = -np.sum(diffs[diffs < 0]) / 14
rs = gains / (losses + 1e-10)
rsi_14 = 100 - (100 / (1 + rs))
# 2. 时间特征
dt_object = datetime.fromtimestamp(klines[i]['ts'] / 1000)
hour_of_day = dt_object.hour
day_of_week = dt_object.weekday()
# 组合所有特征
current_features = [price_change_15m, volatility_30m, rsi_14, hour_of_day, day_of_week]
features.append(current_features)
# 3. 数据标注
future_price = klines[i + PREDICT_HORIZON]['close']
current_price = klines[i]['close']
if future_price > current_price * (1 + SPREAD_THRESHOLD):
labels.append(0) # 涨
elif future_price < current_price * (1 - SPREAD_THRESHOLD):
labels.append(1) # 跌
else:
labels.append(2) # 横盘
그런 다음 세 가지 범주를 사용하여 상승, 하락, 옆으로의 차이를 구분합니다.
기능 스크리닝의 핵심 아이디어: "좋은 팀원"을 찾고 "나쁜 팀원"을 제거하세요
우리의 목표는 다음과 같은 특징들을 찾는 것입니다.
- 높은 관련성: 각 기능은 향후 가격 변화와 강력한 상관관계를 갖습니다(대상 레이블).
- 낮은 중복성: 특성에는 중복되는 정보가 너무 많아서는 안 됩니다. 예를 들어, "5분 모멘텀"과 "6분 모멘텀"은 매우 유사합니다. 두 정보를 모두 포함하더라도 모델이 크게 향상되지 않고 오히려 노이즈가 발생할 수 있습니다.
- 안정성: 기능의 유효성은 시간이 지남에 따라 너무 빨리 변할 수 없습니다. 하루만 유효한 기능은 위험합니다.
def run_analysis_report(X, y, clf, scaler):
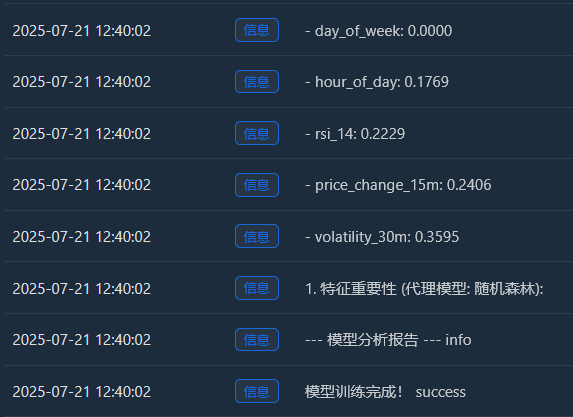
Log("--- 模型分析报告 ---", "info")
Log("1. 特征重要性 (代理模型: 随机森林):")
rf = RandomForestClassifier(n_estimators=50, random_state=42); rf.fit(X, y)
importances = sorted(zip(g_feature_names, rf.feature_importances_), key=lambda x: x[1], reverse=True)
for name, importance in importances: Log(f" - {name}: {importance:.4f}")
Log("2. 特征与标签的互信息:"); mi_scores = mutual_info_classif(X, y)
mi_scores = sorted(zip(g_feature_names, mi_scores), key=lambda x: x[1], reverse=True)
for name, score in mi_scores: Log(f" - {name}: {score:.4f}")
Log("3. 历史数据回测表现:"); y_pred = clf.predict(scaler.transform(X)); accuracy = accuracy_score(y, y_pred)
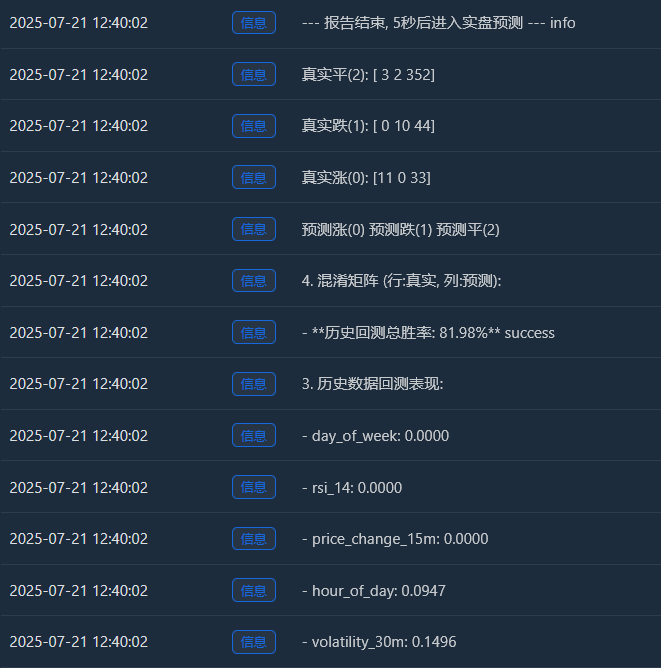
Log(f" - **历史回测总胜率: {accuracy * 100:.2f}%**", "success")
Log("4. 混淆矩阵 (行:真实, 列:预测):"); cm = confusion_matrix(y, y_pred)
Log(" 预测涨(0) 预测跌(1) 预测平(2)"); Log(f"真实涨(0): {cm[0] if len(cm) > 0 else [0,0,0]}")
Log(f"真实跌(1): {cm[1] if len(cm) > 1 else [0,0,0]}"); Log(f"真实平(2): {cm[2] if len(cm) > 2 else [0,0,0]}")
profit_chart = Chart({'title': {'text': f'历史回测净值曲线 (胜率: {accuracy*100:.2f}%)'}}); profit_chart.reset(); balance = 1
for i in range(len(y)):
if y_pred[i] == y[i] and y[i] != 2: balance *= (1 + 0.01)
elif y_pred[i] != y[i] and y_pred[i] != 2: balance *= (1 - 0.01)
profit_chart.add(i, balance)
Log("--- 报告结束, 5秒后进入实盘预测 ---", "info"); Sleep(5000)
과정은 다음과 같습니다.
데이터 수집

기능 중요도
피처와 레이블 간의 상호 정보 및 백테스트 정보
원래는 승률 65%면 충분할 거라고 생각했는데, 81.98%까지 오를 줄은 몰랐네요. 제 첫 반응은 "정말 멋지긴 한데, 믿기 어려울 정도로 좋네요. 뭔가 탐구해 볼 만한 게 있을 거예요."였을 겁니다.
1. 분석 보고서의 심층적 해석, 보고서 내용을 하나씩 해석:
- 기능 중요도 및 상호 정보:
가장 중요한 지표는 변동성_30m과 가격_변화_15m입니다. 이는 최근 시장 추세와 변동성이 미래를 가장 강력하게 예측하는 지표임을 시사하는 논리적인 지표입니다.
hour_of_day도 약간 기여하는데, 이는 모델이 하루 중 여러 시간대의 거래 패턴을 포착한다는 것을 나타냅니다.
rsi_14와 day_of_week의 기여도는 거의 0으로, 이는 이 두 특성이 현재 데이터셋과 특성 조합에서 "돼지 팀메이트" 역할을 할 수 있음을 시사합니다. 향후 모델을 단순화하고 노이즈를 방지하기 위해 이 두 특성을 제거하는 것을 고려할 수 있습니다. - 혼동 행렬(정보가 너무 많아요!)
실제 증가(0):[11 0 33] -> 44번(11+0+33)의 실제 상승세 중 모델은 11번을 정확하게 예측했지만 33번은 "통합"으로 잘못 예측했습니다.
실제 드롭(1):[0 10 44] -> 54개(0+10+44)의 실제 감소 중 모델은 10개를 정확하게 예측했지만 44개는 "측면 추세"로 잘못 예측했습니다.
실제 핑(2):[3 2 352] -> 357건(3+2+352)의 실제 통합 중 이 모델은 352건을 정확하게 예측했습니다! - 과거 백테스트 총 승률: 81.98%
이 높은 승률의 핵심은 바로 이 모델이 "통합"을 예측하는 데 있어 매우 높은 정확도를 보인다는 것입니다! 총 약 455개의 샘플 중 350개 이상이 통합 시장이었으며, 이 모델은 이를 거의 완벽하게 식별했습니다.
이 기능 자체만으로도 매우 귀중한 능력입니다! "지금은 움직이지 않는 것이 최선입니다"라고 정확하게 알려주는 모델은 수수료와 무효 거래를 크게 줄이는 데 도움이 될 수 있습니다.
2실제 승률이 81.98%보다 낮을 수 있는 이유는 무엇일까요?
- "통합"의 정의가 너무 느슨합니다. SPREAD_THRESHOLD는 0.5%입니다. 15분 내 가격 변동폭이 0.5%를 넘지 않는 경우는 매우 흔합니다. 결과적으로 "통합" 샘플이 데이터 세트의 대부분(약 80%)을 차지합니다. 이 모델은 "확실하지 않을 때는 높은 정확도로 '통합'을 추측하세요."라는 명쾌한 학습을 했습니다. 이는 통계적으로는 정확하지만, 트레이딩에서는 가격 변동을 예측하는 데 더 중점을 둡니다.
- 상승과 하락을 예측하는 능력:
상승 추세 예측 승률: 이 모델은 11 + 0 + 3 = 14개의 상승 추세를 예측했으며, 그중 11개만 적중했습니다. 승률은 11 / 14 = 78.5%입니다. 훌륭합니다!
하락 예측 승률: 이 모델은 0 + 10 + 2 = 12회의 하락을 예측했고, 그중 10회는 적중했습니다. 승률은 10 / 12 = 83.3%입니다. 다시 한번, 매우 인상적입니다! - 표본 내 과적합: 이 검정은 모델이 "알고 있는" 데이터(즉, 훈련 및 검정에 사용되는 데이터)에 대해 수행됩니다. 이는 학생에게 방금 끝낸 시험을 치르도록 하는 것과 같습니다. 점수는 대개 높을 것입니다. 하지만 새롭고 보이지 않는 데이터(실시간 거래)에 대한 모델의 성능은 거의 항상 이 점수보다 낮습니다.
이제 우리는 예비적이지만 잠재적으로 엄청난 "알파 모델"을 갖게 되었습니다. 81.98%라는 수치를 미래에 대한 현실적인 예측으로 직접 해석할 수는 없지만, 이는 강력한 긍정적 신호이며, 데이터에 예측 가능한 패턴이 존재하며 우리 프레임워크가 이를 성공적으로 포착했음을 보여줍니다!
이제 우리는 산기슭에서 고품질 금광석을 처음으로 발견한 것 같은 기분이 듭니다. 다음 단계는 바로 판매하는 것이 아니라, 더욱 전문적인 도구와 기술(특성 최적화 및 매개변수 조정)을 사용하여 산 전체를 더욱 효율적이고 안정적으로 채굴하는 것입니다.
이제 "미시세계"의 전쟁의 안개, 즉 주문 흐름과 주문장 특성을 소개하겠습니다.
1단계: 데이터 수집 업그레이드 - 더욱 심층적인 채널 구독
주문장 데이터를 얻으려면 WebSocket 연결 방법을 aggTrade(거래)만 구독하는 것에서 aggTrade와 depth(깊이)를 모두 구독하는 것으로 수정해야 합니다.
이렇게 하려면 보다 일반적인 다중 스트림 구독 URL을 사용해야 합니다.
2단계: 피처 엔지니어링 업그레이드 - "바다, 육지, 공중"에 대한 삼위일체 피처 행렬 구축
calculate_features_and_labels 함수에 다음과 같은 새로운 기능을 추가합니다.
- 주문 흐름 특성(알파 - 단기):
alpha_15m: 15분 주문 흐름 불균형 계수입니다. 이는 앞서 논의한 핵심 주문 흐름 지표입니다. - 주문서 특성(주문서 - 군대):
wobi_10s: 지난 10초 동안의 가중 주문장 불균형입니다. 시장의 매수 및 매도 압력을 측정하는 매우 높은 빈도의 지표입니다.
spread_10s: 지난 10초 동안의 평균 매수-매도 호가 스프레드입니다. 단기 유동성을 반영합니다. - 원래 특성 (가격 - 네이비):
이전 버전에서 가장 성능이 좋은 기능을 유지하고 최적화할 예정입니다.
이 새로운 기능 매트릭스는 마치 "바다(가격 동향)", "육지(시장 위치)", "공중(거래 영향)"으로부터 실시간 정보를 동시에 파악하는 합동 전투 지휘부와 같으며, 그 의사결정 능력은 이전보다 훨씬 뛰어날 것입니다.
코드는 다음과 같습니다.
import json
import math
import time
import websocket
import threading
from datetime import datetime
import numpy as np
from sklearn import svm
from sklearn.preprocessing import StandardScaler
from sklearn.metrics import confusion_matrix, accuracy_score
from sklearn.feature_selection import mutual_info_classif
from sklearn.ensemble import RandomForestClassifier

# ========== 全局配置 ==========
TRAIN_BARS = 100
PREDICT_HORIZON = 15
SPREAD_THRESHOLD = 0.005
SYMBOL_FMZ = "ETH_USDT"
SYMBOL_API = SYMBOL_FMZ.replace('_', '').lower()
WEBSOCKET_URL = f"wss://fstream.binance.com/stream?streams={SYMBOL_API}@aggTrade/{SYMBOL_API}@depth20@100ms"

# ========== 全局状态变量 ==========
g_model, g_scaler = None, None
g_klines_1min, g_ticks, g_order_book_history = [], [], []
g_last_kline_ts = 0
g_feature_names = ['price_change_15m', 'volatility_30m', 'rsi_14', 'hour_of_day',
                   'alpha_15m', 'wobi_10s', 'spread_10s']

# ========== 特征工程与模型训练 ==========
def calculate_features_and_labels(klines, ticks, order_books_history, is_realtime=False):
    features, labels = [], []
    close_prices = [k['close'] for k in klines]

    # 根据是训练还是实时预测,决定循环范围
    start_index = 30
    end_index = len(klines) - PREDICT_HORIZON if not is_realtime else len(klines)

    for i in range(start_index, end_index):
        kline_start_ts = klines[i]['ts']

        # --- 特征计算部分 ---
        price_change_15m = (klines[i]['close'] - klines[i-15]['close']) / klines[i-15]['close']
        volatility_30m = np.std(close_prices[i-30:i])
        diffs = np.diff(close_prices[i-14:i+1]); gains = np.sum(diffs[diffs > 0]) / 14; losses = -np.sum(diffs[diffs < 0]) / 14
        rsi_14 = 100 - (100 / (1 + gains / (losses + 1e-10)))
        dt_object = datetime.fromtimestamp(kline_start_ts / 1000)
        ticks_in_15m = [t for t in ticks if t['ts'] >= klines[i-15]['ts'] and t['ts'] < kline_start_ts]
        buy_vol = sum(t['qty'] for t in ticks_in_15m if t['side'] == 'buy'); sell_vol = sum(t['qty'] for t in ticks_in_15m if t['side'] == 'sell')
        alpha_15m = (buy_vol - sell_vol) / (buy_vol + sell_vol + 1e-10)
        books_in_10s = [b for b in order_books_history if b['ts'] >= kline_start_ts - 10000 and b['ts'] < kline_start_ts]
        if not books_in_10s: wobi_10s, spread_10s = 0, 0.0
        else:
            wobis, spreads = [], []
            for book in books_in_10s:
                if not book['bids'] or not book['asks']: continue
                bid_vol = sum(float(p[1]) for p in book['bids']); ask_vol = sum(float(p[1]) for p in book['asks'])
                wobis.append(bid_vol / (bid_vol + ask_vol + 1e-10))
                spreads.append(float(book['asks'][0][0]) - float(book['bids'][0][0]))
            wobi_10s = np.mean(wobis) if wobis else 0; spread_10s = np.mean(spreads) if spreads else 0
        current_features = [price_change_15m, volatility_30m, rsi_14, dt_object.hour, alpha_15m, wobi_10s, spread_10s]
        features.append(current_features)

        # --- 标签计算部分  ---
        if not is_realtime:
            future_price = klines[i + PREDICT_HORIZON]['close']; current_price = klines[i]['close']
            if future_price > current_price * (1 + SPREAD_THRESHOLD): labels.append(0)
            elif future_price < current_price * (1 - SPREAD_THRESHOLD): labels.append(1)
            else: labels.append(2)

    return np.array(features), np.array(labels)

def run_analysis_report(X, y, clf, scaler):
    Log("--- 模型分析报告 ---", "info")
    Log("1. 特征重要性 (代理模型: 随机森林):")
    rf = RandomForestClassifier(n_estimators=50, random_state=42); rf.fit(X, y)
    importances = sorted(zip(g_feature_names, rf.feature_importances_), key=lambda x: x[1], reverse=True)
    for name, importance in importances: Log(f"   - {name}: {importance:.4f}")
    Log("2. 特征与标签的互信息:"); mi_scores = mutual_info_classif(X, y)
    mi_scores = sorted(zip(g_feature_names, mi_scores), key=lambda x: x[1], reverse=True)
    for name, score in mi_scores: Log(f"   - {name}: {score:.4f}")
    Log("3. 历史数据回测表现:"); y_pred = clf.predict(scaler.transform(X)); accuracy = accuracy_score(y, y_pred)
    Log(f"   - **历史回测总胜率: {accuracy * 100:.2f}%**", "success")
    Log("4. 混淆矩阵 (行:真实, 列:预测):"); cm = confusion_matrix(y, y_pred)
    Log("      预测涨(0) 预测跌(1) 预测平(2)"); Log(f"真实涨(0): {cm[0] if len(cm) > 0 else [0,0,0]}")
    Log(f"真实跌(1): {cm[1] if len(cm) > 1 else [0,0,0]}"); Log(f"真实平(2): {cm[2] if len(cm) > 2 else [0,0,0]}")
    profit_chart = Chart({'title': {'text': f'历史回测净值曲线 (胜率: {accuracy*100:.2f}%)'}}); profit_chart.reset(); balance = 1
    for i in range(len(y)):
        if y_pred[i] == y[i] and y[i] != 2: balance *= (1 + 0.01)
        elif y_pred[i] != y[i] and y_pred[i] != 2: balance *= (1 - 0.01)
        profit_chart.add(i, balance)
    Log("--- 报告结束, 5秒后进入实盘预测 ---", "info"); Sleep(5000)

def train_and_analyze():
    global g_model, g_scaler, g_klines_1min, g_ticks, g_order_book_history
    MIN_REQUIRED_BARS = 30 + PREDICT_HORIZON
    if len(g_klines_1min) < MIN_REQUIRED_BARS:
        Log(f"K线数量({len(g_klines_1min)})不足以进行特征工程,需要至少 {MIN_REQUIRED_BARS} 根。", "warning"); return False
    Log("开始训练模型 (V2.2)...")
    X, y = calculate_features_and_labels(g_klines_1min, g_ticks, g_order_book_history)
    if len(X) < 50 or len(set(y)) < 3:
        Log(f"有效训练样本不足(X: {len(X)}, 类别: {len(set(y))}),无法训练。", "warning"); return False
    scaler = StandardScaler(); X_scaled = scaler.fit_transform(X)
    clf = svm.SVC(kernel='rbf', C=1.0, gamma='scale'); clf.fit(X_scaled, y)
    g_model, g_scaler = clf, scaler
    Log("模型训练完成!", "success")
    run_analysis_report(X, y, g_model, g_scaler)
    return True

def aggregate_ticks_to_kline(ticks):
    if not ticks: return None
    return {'ts': ticks[0]['ts'] // 60000 * 60000, 'open': ticks[0]['price'], 'high': max(t['price'] for t in ticks), 'low': min(t['price'] for t in ticks), 'close': ticks[-1]['price'], 'volume': sum(t['qty'] for t in ticks)}

def on_message(ws, message):
    global g_ticks, g_klines_1min, g_last_kline_ts, g_order_book_history
    try:
        payload = json.loads(message)
        data = payload.get('data', {}); stream = payload.get('stream', '')
        if 'aggTrade' in stream:
            trade_data = {'ts': int(data['T']), 'price': float(data['p']), 'qty': float(data['q']), 'side': 'sell' if data['m'] else 'buy'}
            g_ticks.append(trade_data)
            current_minute_ts = trade_data['ts'] // 60000 * 60000
            if g_last_kline_ts == 0: g_last_kline_ts = current_minute_ts
            if current_minute_ts > g_last_kline_ts:
                last_minute_ticks = [t for t in g_ticks if t['ts'] >= g_last_kline_ts and t['ts'] < current_minute_ts]
                if last_minute_ticks:
                    kline = aggregate_ticks_to_kline(last_minute_ticks); g_klines_1min.append(kline)
                    g_ticks = [t for t in g_ticks if t['ts'] >= current_minute_ts]
                g_last_kline_ts = current_minute_ts
        elif 'depth' in stream:
            book_snapshot = {'ts': int(data['E']), 'bids': data['b'], 'asks': data['a']}
            g_order_book_history.append(book_snapshot)
            if len(g_order_book_history) > 5000: g_order_book_history.pop(0)
    except Exception as e: Log(f"OnMessage Error: {e}")

def start_websocket():
    ws = websocket.WebSocketApp(WEBSOCKET_URL, on_message=on_message)
    wst = threading.Thread(target=ws.run_forever); wst.daemon = True; wst.start()
    Log("WebSocket多流订阅已启动...")

# ========== 主程序入口  ==========
def main():
    global TRAIN_BARS

    exchange.SetContractType("swap")
    start_websocket()
    Log("策略启动,进入数据收集中...")
    main.last_predict_ts = 0

    while True:
        if g_model is None:
            # --- 训练模式 ---
            if len(g_klines_1min) >= TRAIN_BARS:
                if not train_and_analyze():
                    Log("模型训练或分析失败,将增加50根K线后重试...", "error")
                    TRAIN_BARS += 50
            else:
                LogStatus(f"正在收集K线数据: {len(g_klines_1min)} / {TRAIN_BARS}")
        else:
            # --- **新功能:实时预测模式** ---
            if len(g_klines_1min) > 0 and g_klines_1min[-1]['ts'] > main.last_predict_ts:
                # 1. 标记已处理,防止重复预测
                main.last_predict_ts = g_klines_1min[-1]['ts']
                kline_time_str = datetime.fromtimestamp(main.last_predict_ts / 1000).strftime('%H:%M:%S')
                Log(f"检测到新K线 ({kline_time_str}),准备进行实时预测...")

                # 2. 检查是否有足够历史数据来为这根新K线计算特征
                if len(g_klines_1min) < 30: # 至少需要30根历史K线
                    Log("历史K线不足,无法为当前新K线计算特征。", "warning")
                    continue

                # 3. 计算最新K线的特征
                # 我们只计算最后一条数据,所以传入 is_realtime=True
                latest_features, _ = calculate_features_and_labels(g_klines_1min, g_ticks, g_order_book_history, is_realtime=True)

                if latest_features.shape[0] == 0:
                    Log("无法为最新K线生成有效特征。", "warning")
                    continue

                # 4. 标准化并预测
                last_feature_vector = latest_features[-1].reshape(1, -1)
                last_feature_scaled = g_scaler.transform(last_feature_vector)
                prediction = g_model.predict(last_feature_scaled)[0]

                # 5. 展示预测结果
                prediction_text = ['**上涨**', '**下跌**', '盘整'][prediction]
                Log(f"==> 实时预测结果 ({kline_time_str}): 未来 {PREDICT_HORIZON} 分钟可能 {prediction_text}", "success" if prediction != 2 else "info")

                # 在这里,您可以根据 prediction 的结果,添加您的开平仓交易逻辑
                # 例如: if prediction == 0: exchange.Buy(...)

            else:
                LogStatus(f"模型已就绪,等待新K线... 当前K线数: {len(g_klines_1min)}")

        Sleep(1000) # 每秒检查一次是否有新K线
이 코드는 많은 K-라인 계산을 요구합니다.
이 보고서는 모델의 "생각"과 "특성"을 알려주기 때문에 엄청난 가치가 있습니다.
- 과거 백테스트 총 승률: 93.33%
정말 인상적인 수치입니다! 객관적으로 살펴봐야 하지만(샘플 내 테스트이기 때문에), 새로 추가된 주문 흐름 및 주문장 기능의 엄청난 예측력을 분명히 보여줍니다! 이 모델은 과거 데이터에서 매우 강력한 패턴을 발견했습니다. - 기능 중요도 및 상호 정보
왕이 탄생했습니다. volatility_15m(변동성)과 price_change_5m(가격 변화)은 여전히 절대적으로 핵심이며, 이는 예상한 대로입니다.
떠오르는 별: rsi_14의 중요성이 크게 증가했습니다! 이는 5분 단위의 짧은 시간 프레임에서 RSI의 "과매수/과매도" 심리 지표의 의미가 더욱 커졌음을 나타냅니다.
잠재적으로 wobi_10s(주문장 불균형)와 spread_10s(스프레드)도 어느 정도 영향을 미치는 것으로 보입니다. 이는 매우 고무적이며, 당사의 미세 구조 특성이 효과를 발휘하기 시작했다는 것을 시사합니다!
반성: alpha_5m(주문 흐름)의 기여도는 거의 0입니다. 이는 알파 계산 방식이 지나치게 단순화되었거나, 5분 알파와 5분 가격 변동 자체에 중복되는 정보가 너무 많기 때문일 수 있습니다. 이는 향후 최적화에 중요한 요소입니다. - 혼동 행렬(성공의 핵심 증거!)
실제 증가(0):[22 0] -> 실제 랠리 22개를 모두 모델이 100% 정확하게 예측했고, 실수도 없었습니다!
실제 드롭(1):[2 6] -> 실제 감소 8건 중 모델은 6건을 정확하게 예측했고 2건을 놓쳤습니다(증가로 오인).
해석: 이 모델은 매우 흥미로운 특징을 보입니다. 매우 강력한 강세 감지기로 강세 신호를 거의 완벽하게 포착합니다. 또한 약세 추세를 식별하는 데도 효과적이지만(6/8 = 75% 정확도), 때때로 약세 추세를 상승 추세로 오인하는 실수를 범합니다.
그 다음은 무엇입니까?
"트레이딩 시그널 상태 머신" 소개
이것이 이 업그레이드의 핵심이자 가장 독창적인 부분입니다. 전략의 현재 "포지션" 상태를 관리하기 위해 g_active_signal과 같은 전역 상태 변수를 도입합니다(이는 가상 포지션 상태일 뿐이며 실제 거래와 관련이 없음).
이 상태 머신의 작동 논리는 다음과 같습니다.
- 초기 상태: 유휴
- 전략이 이 상태에 있으면 지금과 마찬가지로 각각의 새로운 K-라인에 대한 예측을 내리게 됩니다.
- 정권 전환: 모델이 명확한 신호(예: "상승")를 예측하면 전략은 다음과 같이 진행됩니다.
- 저널에 눈길을 끄는 단일 진입 신호를 인쇄합니다(예: 🎯 새로운 거래 신호: 예측 상향! 관찰 시간 15분).
- 전략 상태를 대기 상태에서 신호 대기 상태로 전환합니다.
트리거 시간과 현재 신호의 방향을 기록합니다.
- 직위 상태: 신호
- 전략이 이 상태에 도달하면 새로운 K 라인 예측을 완전히 중단합니다. 더 이상 매 순간의 변동에 신경 쓰지 않고 "렛 더 블릿 플라이(Let the Bullet Fleet)" 모드로 전환됩니다.
- 이 함수가 하는 일은 시간을 확인하는 것뿐입니다. 신호가 트리거된 후 15분(PREDICT_HORIZON의 길이)이 지났는지 확인하는 것입니다.
- 상태 전환: 15분 관찰 기간 후 정책은 다음과 같이 진행됩니다.
- 로그에 명확한 종료 신호(예: 🏁 신호 기간 종료)를 출력하세요. 전략을 재설정하고 새로운 기회를 찾으세요...
- 전략 상태를 보류에서 유휴로 전환합니다.
- 이 시점에서 전략은 새로운 K-라인을 다시 예측하고 다음 거래 기회를 모색합니다.
이 간단한 상태 머신을 통해 우리는 하나의 신호, 하나의 완전한 관찰 주기, 그리고 해당 기간 동안 간섭 정보가 없다는 요구 사항을 완벽하게 충족했습니다.
            import json
import math
import time
import websocket
import threading
from datetime import datetime
import numpy as np
from sklearn import svm
from sklearn.preprocessing import StandardScaler
from sklearn.metrics import confusion_matrix, accuracy_score
from sklearn.feature_selection import mutual_info_classif
from sklearn.ensemble import RandomForestClassifier

# ========== 全局配置 ==========
TRAIN_BARS = 200      #需要更多初始数据
PREDICT_HORIZON = 15  # 回归15分钟预测周期
SPREAD_THRESHOLD = 0.005 # 适配15分钟周期的涨跌阈值
SYMBOL_FMZ = "ETH_USDT"
SYMBOL_API = SYMBOL_FMZ.replace('_', '').lower()
WEBSOCKET_URL = f"wss://fstream.binance.com/stream?streams={SYMBOL_API}@aggTrade/{SYMBOL_API}@depth20@100ms"

# ========== 全局状态变量 ==========
g_model, g_scaler = None, None
g_klines_1min, g_ticks, g_order_book_history = [], [], []
g_last_kline_ts = 0
g_feature_names = ['price_change_15m', 'volatility_30m', 'rsi_14', 'hour_of_day',
                   'alpha_15m', 'wobi_10s', 'spread_10s']
# 新功能: 信号状态机
g_active_signal = {'active': False, 'start_ts': 0, 'prediction': -1}

# ========== 特征工程与模型训练 ==========
def calculate_features_and_labels(klines, ticks, order_books_history, is_realtime=False):
    features, labels = [], []
    close_prices = [k['close'] for k in klines]

    start_index = 30
    end_index = len(klines) - PREDICT_HORIZON if not is_realtime else len(klines)

    for i in range(start_index, end_index):
        kline_start_ts = klines[i]['ts']

        price_change_15m = (klines[i]['close'] - klines[i-15]['close']) / klines[i-15]['close']
        volatility_30m = np.std(close_prices[i-30:i])
        diffs = np.diff(close_prices[i-14:i+1]); gains = np.sum(diffs[diffs > 0]) / 14; losses = -np.sum(diffs[diffs < 0]) / 14
        rsi_14 = 100 - (100 / (1 + gains / (losses + 1e-10)))
        dt_object = datetime.fromtimestamp(kline_start_ts / 1000)
        ticks_in_15m = [t for t in ticks if t['ts'] >= klines[i-15]['ts'] and t['ts'] < kline_start_ts]
        buy_vol = sum(t['qty'] for t in ticks_in_15m if t['side'] == 'buy'); sell_vol = sum(t['qty'] for t in ticks_in_15m if t['side'] == 'sell')
        alpha_15m = (buy_vol - sell_vol) / (buy_vol + sell_vol + 1e-10)
        books_in_10s = [b for b in order_books_history if b['ts'] >= kline_start_ts - 10000 and b['ts'] < kline_start_ts]
        if not books_in_10s: wobi_10s, spread_10s = 0, 0.0
        else:
            wobis, spreads = [], []
            for book in books_in_10s:
                if not book['bids'] or not book['asks']: continue
                bid_vol = sum(float(p[1]) for p in book['bids']); ask_vol = sum(float(p[1]) for p in book['asks'])
                wobis.append(bid_vol / (bid_vol + ask_vol + 1e-10))
                spreads.append(float(book['asks'][0][0]) - float(book['bids'][0][0]))
            wobi_10s = np.mean(wobis) if wobis else 0; spread_10s = np.mean(spreads) if spreads else 0

        current_features = [price_change_15m, volatility_30m, rsi_14, dt_object.hour, alpha_15m, wobi_10s, spread_10s]

        if not is_realtime:
            future_price = klines[i + PREDICT_HORIZON]['close']; current_price = klines[i]['close']
            if future_price > current_price * (1 + SPREAD_THRESHOLD):
                labels.append(0); features.append(current_features)
            elif future_price < current_price * (1 - SPREAD_THRESHOLD):
                labels.append(1); features.append(current_features)
        else:
            features.append(current_features)

    return np.array(features), np.array(labels)

def run_analysis_report(X, y, clf, scaler):
    Log("--- 模型分析报告 V2.5 (15分钟预测) ---", "info")
    Log("1. 特征重要性 (代理模型: 随机森林):")
    rf = RandomForestClassifier(n_estimators=50, random_state=42); rf.fit(X, y)
    importances = sorted(zip(g_feature_names, rf.feature_importances_), key=lambda x: x[1], reverse=True)
    for name, importance in importances: Log(f"   - {name}: {importance:.4f}")
    Log("2. 特征与标签的互信息:"); mi_scores = mutual_info_classif(X, y)
    mi_scores = sorted(zip(g_feature_names, mi_scores), key=lambda x: x[1], reverse=True)
    for name, score in mi_scores: Log(f"   - {name}: {score:.4f}")
    Log("3. 历史数据回测表现:"); y_pred = clf.predict(scaler.transform(X)); accuracy = accuracy_score(y, y_pred)
    Log(f"   - **历史回测总胜率: {accuracy * 100:.2f}%**", "success")
    Log("4. 混淆矩阵 (行:真实, 列:预测):"); cm = confusion_matrix(y, y_pred)
    Log("      预测涨(0) 预测跌(1)"); Log(f"真实涨(0): {cm[0] if len(cm) > 0 else [0,0]}")
    Log(f"真实跌(1): {cm[1] if len(cm) > 1 else [0,0]}")
    profit_chart = Chart({'title': {'text': f'历史回测净值曲线 (胜率: {accuracy*100:.2f}%)'}}); profit_chart.reset(); balance = 1
    for i in range(len(y)):
        if y_pred[i] == y[i]: balance *= (1 + 0.01)
        else: balance *= (1 - 0.01)
        profit_chart.add(i, balance)
    Log("--- 报告结束, 5秒后进入实盘预测 ---", "info"); Sleep(5000)

def train_and_analyze():
    global g_model, g_scaler, g_klines_1min, g_ticks, g_order_book_history
    MIN_REQUIRED_BARS = 30 + PREDICT_HORIZON
    if len(g_klines_1min) < MIN_REQUIRED_BARS:
        Log(f"K线数量({len(g_klines_1min)})不足以进行特征工程,需要至少 {MIN_REQUIRED_BARS} 根。", "warning"); return False
    Log("开始训练模型 (V2.5)...")
    X, y = calculate_features_and_labels(g_klines_1min, g_ticks, g_order_book_history)
    if len(X) < 20 or len(set(y)) < 2:
        Log(f"有效涨跌样本不足(X: {len(X)}, 类别: {len(set(y))}),无法训练。", "warning"); return False
    scaler = StandardScaler(); X_scaled = scaler.fit_transform(X)
    clf = svm.SVC(kernel='rbf', C=1.0, gamma='scale'); clf.fit(X_scaled, y)
    g_model, g_scaler = clf, scaler
    Log("模型训练完成!", "success")
    run_analysis_report(X, y, g_model, g_scaler)
    return True

# ========== WebSocket实时数据处理 ==========
def aggregate_ticks_to_kline(ticks):
    if not ticks: return None
    return {'ts': ticks[0]['ts'] // 60000 * 60000, 'open': ticks[0]['price'], 'high': max(t['price'] for t in ticks), 'low': min(t['price'] for t in ticks), 'close': ticks[-1]['price'], 'volume': sum(t['qty'] for t in ticks)}

def on_message(ws, message):
    global g_ticks, g_klines_1min, g_last_kline_ts, g_order_book_history
    try:
        payload = json.loads(message)
        data = payload.get('data', {}); stream = payload.get('stream', '')
        if 'aggTrade' in stream:
            trade_data = {'ts': int(data['T']), 'price': float(data['p']), 'qty': float(data['q']), 'side': 'sell' if data['m'] else 'buy'}
            g_ticks.append(trade_data)
            current_minute_ts = trade_data['ts'] // 60000 * 60000
            if g_last_kline_ts == 0: g_last_kline_ts = current_minute_ts
            if current_minute_ts > g_last_kline_ts:
                last_minute_ticks = [t for t in g_ticks if t['ts'] >= g_last_kline_ts and t['ts'] < current_minute_ts]
                if last_minute_ticks:
                    kline = aggregate_ticks_to_kline(last_minute_ticks); g_klines_1min.append(kline)
                    g_ticks = [t for t in g_ticks if t['ts'] >= current_minute_ts]
                g_last_kline_ts = current_minute_ts
        elif 'depth' in stream:
            book_snapshot = {'ts': int(data['E']), 'bids': data['b'], 'asks': data['a']}
            g_order_book_history.append(book_snapshot)
            if len(g_order_book_history) > 5000: g_order_book_history.pop(0)
    except Exception as e: Log(f"OnMessage Error: {e}")

def start_websocket():
    ws = websocket.WebSocketApp(WEBSOCKET_URL, on_message=on_message)
    wst = threading.Thread(target=ws.run_forever); wst.daemon = True; wst.start()
    Log("WebSocket多流订阅已启动...")

# ========== 主程序入口 ==========
def main():
    global TRAIN_BARS, g_active_signal
    exchange.SetContractType("swap")
    start_websocket()
    Log("策略启动 ,进入数据收集中...")
    main.last_predict_ts = 0

    while True:
        if g_model is None:
            if len(g_klines_1min) >= TRAIN_BARS:
                if not train_and_analyze():
                    Log(f"模型训练失败,当前目标 {TRAIN_BARS} 根K线。将增加50根后重试...", "error")
                    TRAIN_BARS += 50
            else:
                LogStatus(f"正在收集K线数据: {len(g_klines_1min)} / {TRAIN_BARS}")
        else:
            if not g_active_signal['active']:
                if len(g_klines_1min) > 0 and g_klines_1min[-1]['ts'] > main.last_predict_ts:
                    main.last_predict_ts = g_klines_1min[-1]['ts']
                    kline_time_str = datetime.fromtimestamp(main.last_predict_ts / 1000).strftime('%H:%M:%S')
                    if len(g_klines_1min) < 30:
                        LogStatus("历史K线不足,无法预测。等待更多数据..."); continue
                    latest_features, _ = calculate_features_and_labels(g_klines_1min, g_ticks, g_order_book_history, is_realtime=True)
                    if latest_features.shape[0] == 0:
                        LogStatus(f"({kline_time_str}) 无法生成特征,跳过..."); continue
                    last_feature_vector = latest_features[-1].reshape(1, -1)
                    last_feature_scaled = g_scaler.transform(last_feature_vector)
                    prediction = g_model.predict(last_feature_scaled)[0]
                    if prediction == 0 or prediction == 1:
                        g_active_signal['active'] = True
                        g_active_signal['start_ts'] = main.last_predict_ts
                        g_active_signal['prediction'] = prediction
                        prediction_text = ['**上涨**', '**下跌**'][prediction]
                        Log(f"🎯 新的交易信号 ({kline_time_str}): 预测 {prediction_text}!观察周期 {PREDICT_HORIZON} 分钟。", "success" if prediction == 0 else "error")
                    else:
                        LogStatus(f"({kline_time_str}) 无明确信号,继续观察...")
            else:
                current_ts = time.time() * 1000
                elapsed_minutes = (current_ts - g_active_signal['start_ts']) / (1000 * 60)
                if elapsed_minutes >= PREDICT_HORIZON:
                    Log(f"🏁 信号周期结束。重置策略,寻找新机会...", "info")
                    g_active_signal['active'] = False
                else:
                    prediction_text = ['**上涨**', '**下跌**'][g_active_signal['prediction']]
                    LogStatus(f"信号生效中: {prediction_text}。剩余观察时间: {PREDICT_HORIZON - elapsed_minutes:.1f} 分钟。")
        Sleep(5000)
그런 다음 이 코드를 실행합니다.
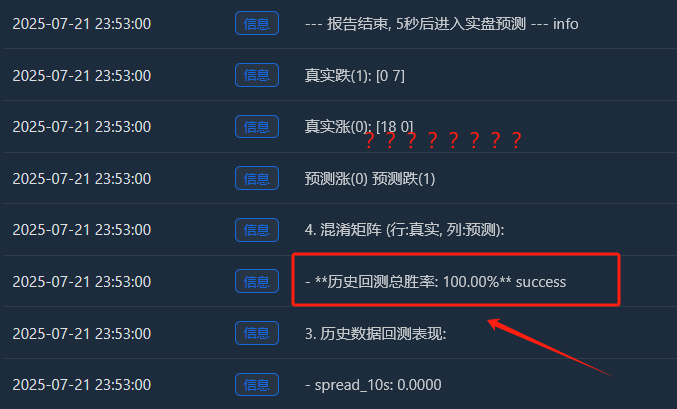
심층 분석: "완벽한" 100% 승률은 왜 존재하는가?
이 "완벽한" 결과는 머신 러닝과 금융 시장에 대한 몇 가지 중요하고 심오한 통찰력을 보여줍니다. 이는 버그가 아니라 특정 조건에서 발생할 수 있는 "과적합"이라는 전형적인 현상입니다.
"과잉적합"이란 무엇을 의미합니까?
-
생생한 비유를 하나 들어보겠습니다. 학생(우리의 SVM 모델)에게 아주 짧고 간단한 연습 문제(우리가 수집한 200개의 캔들스틱 데이터 포인트)를 풀게 한다고 가정해 보겠습니다. 이 학생은 매우 똑똑해서 일반적인 문제 해결 방법을 배우는 대신, 몇 가지 문제에 대한 답을 암기합니다.
-
결과: 동일한 연습 문제 세트(이를 "과거 백테스트"라고 합니다)로 테스트했을 때, 그는 확실히 100점 만점을 받을 수 있었습니다. 그러나 이전에 본 적이 없는 완전히 새로운 문제 세트(실제 선물 시장)를 제시했을 때, 그는 어떤 문제도 답하지 못할 가능성이 높습니다.
- 왜 우리 모델은 "과잉적합"하는가?
-
훈련 샘플이 "너무 적고" "너무 특수합니다":
-
우리는 200개의 K-라인(약 3.3시간)을 수집했지만, 로그에 따르면 우리의 정의를 충족하는 "효과적인 상승 및 하강" 샘플의 최종 개수는 18 + 7 = 25개에 불과했습니다.
-
복잡한 SVM 모델의 경우, 25개 샘플은 바다의 몇 개의 파도와 같아서 너무 적습니다.
-
더 중요한 것은, 이 25개 샘플이 모두 같은 오후에 높은 상관관계를 보이는 시장 상황에서 나왔다는 점입니다. 따라서 샘플들은 매우 유사한 "루틴"을 가지고 있을 가능성이 높습니다.
- 모델 기능이 "너무 강력합니다":
- SVM은 매우 강력한 비선형 분류기입니다. 그 능력은 마치 슈퍼 메모리를 가진 뇌와 같습니다.
- 강력한 모델이 너무 단순하고 반복적인 데이터 집합으로부터 학습하는 경우, 그 이면에 있는 보다 보편적인 거시적 법칙을 학습하기보다는 데이터의 모든 세부 사항과 노이즈를 "기억"하는 경향이 있습니다.
- 혼동 행렬의 증거:
- 실제 증가(0):[18 0] -> 18개의 상승 샘플이 모두 완벽하게 암기되었습니다.
- 실제 드롭(1):[0 7] -> 7개의 떨어지는 샘플이 모두 완벽하게 기억되었습니다.
- 이 완벽한[ [18, 0], [[0, 7] 행렬은 모델의 과적합을 반박할 수 없는 증거입니다. 이 행렬은 거의 오류를 범하지 않는데, 이는 무작위성이 가득한 금융 시장에서는 본질적으로 비정상적인 현상입니다.
따라서 우리는 이 100% 승률을 다음과 같이 해석해야 합니다.
"이 모델은 지난 3시간 동안 특정 시장 상황의 모든 패턴을 놀랍도록 학습하고 기억했습니다. 이는 저희 피처 엔지니어링과 모델 프레임워크의 효과를 보여줍니다. 하지만 앞으로 실제 시장에서 이처럼 높은 승률을 유지할 것이라고 기대할 수는 없습니다. 이는 '대학 입학 시험'의 최종 결과라기보다는 완벽한 '깜짝 퀴즈'에 가깝습니다."

머신 러닝 역시 제가 최근에 탐구하고 있는 분야입니다. 다음 호에서 자세히 이야기해 보겠습니다!
우리는 이 "편견을 가진 학생"에게 철저한 "사고 전환"을 실시해야 합니다. 우리의 목표는 그의 편견을 깨고 그가 "기복"을 공정하고 객관적으로 바라볼 수 있도록 돕는 것입니다.
