가장 좋은 슈퍼 트렌드 전략
저자:차오장, 날짜: 2023-09-09 22:18:31태그:
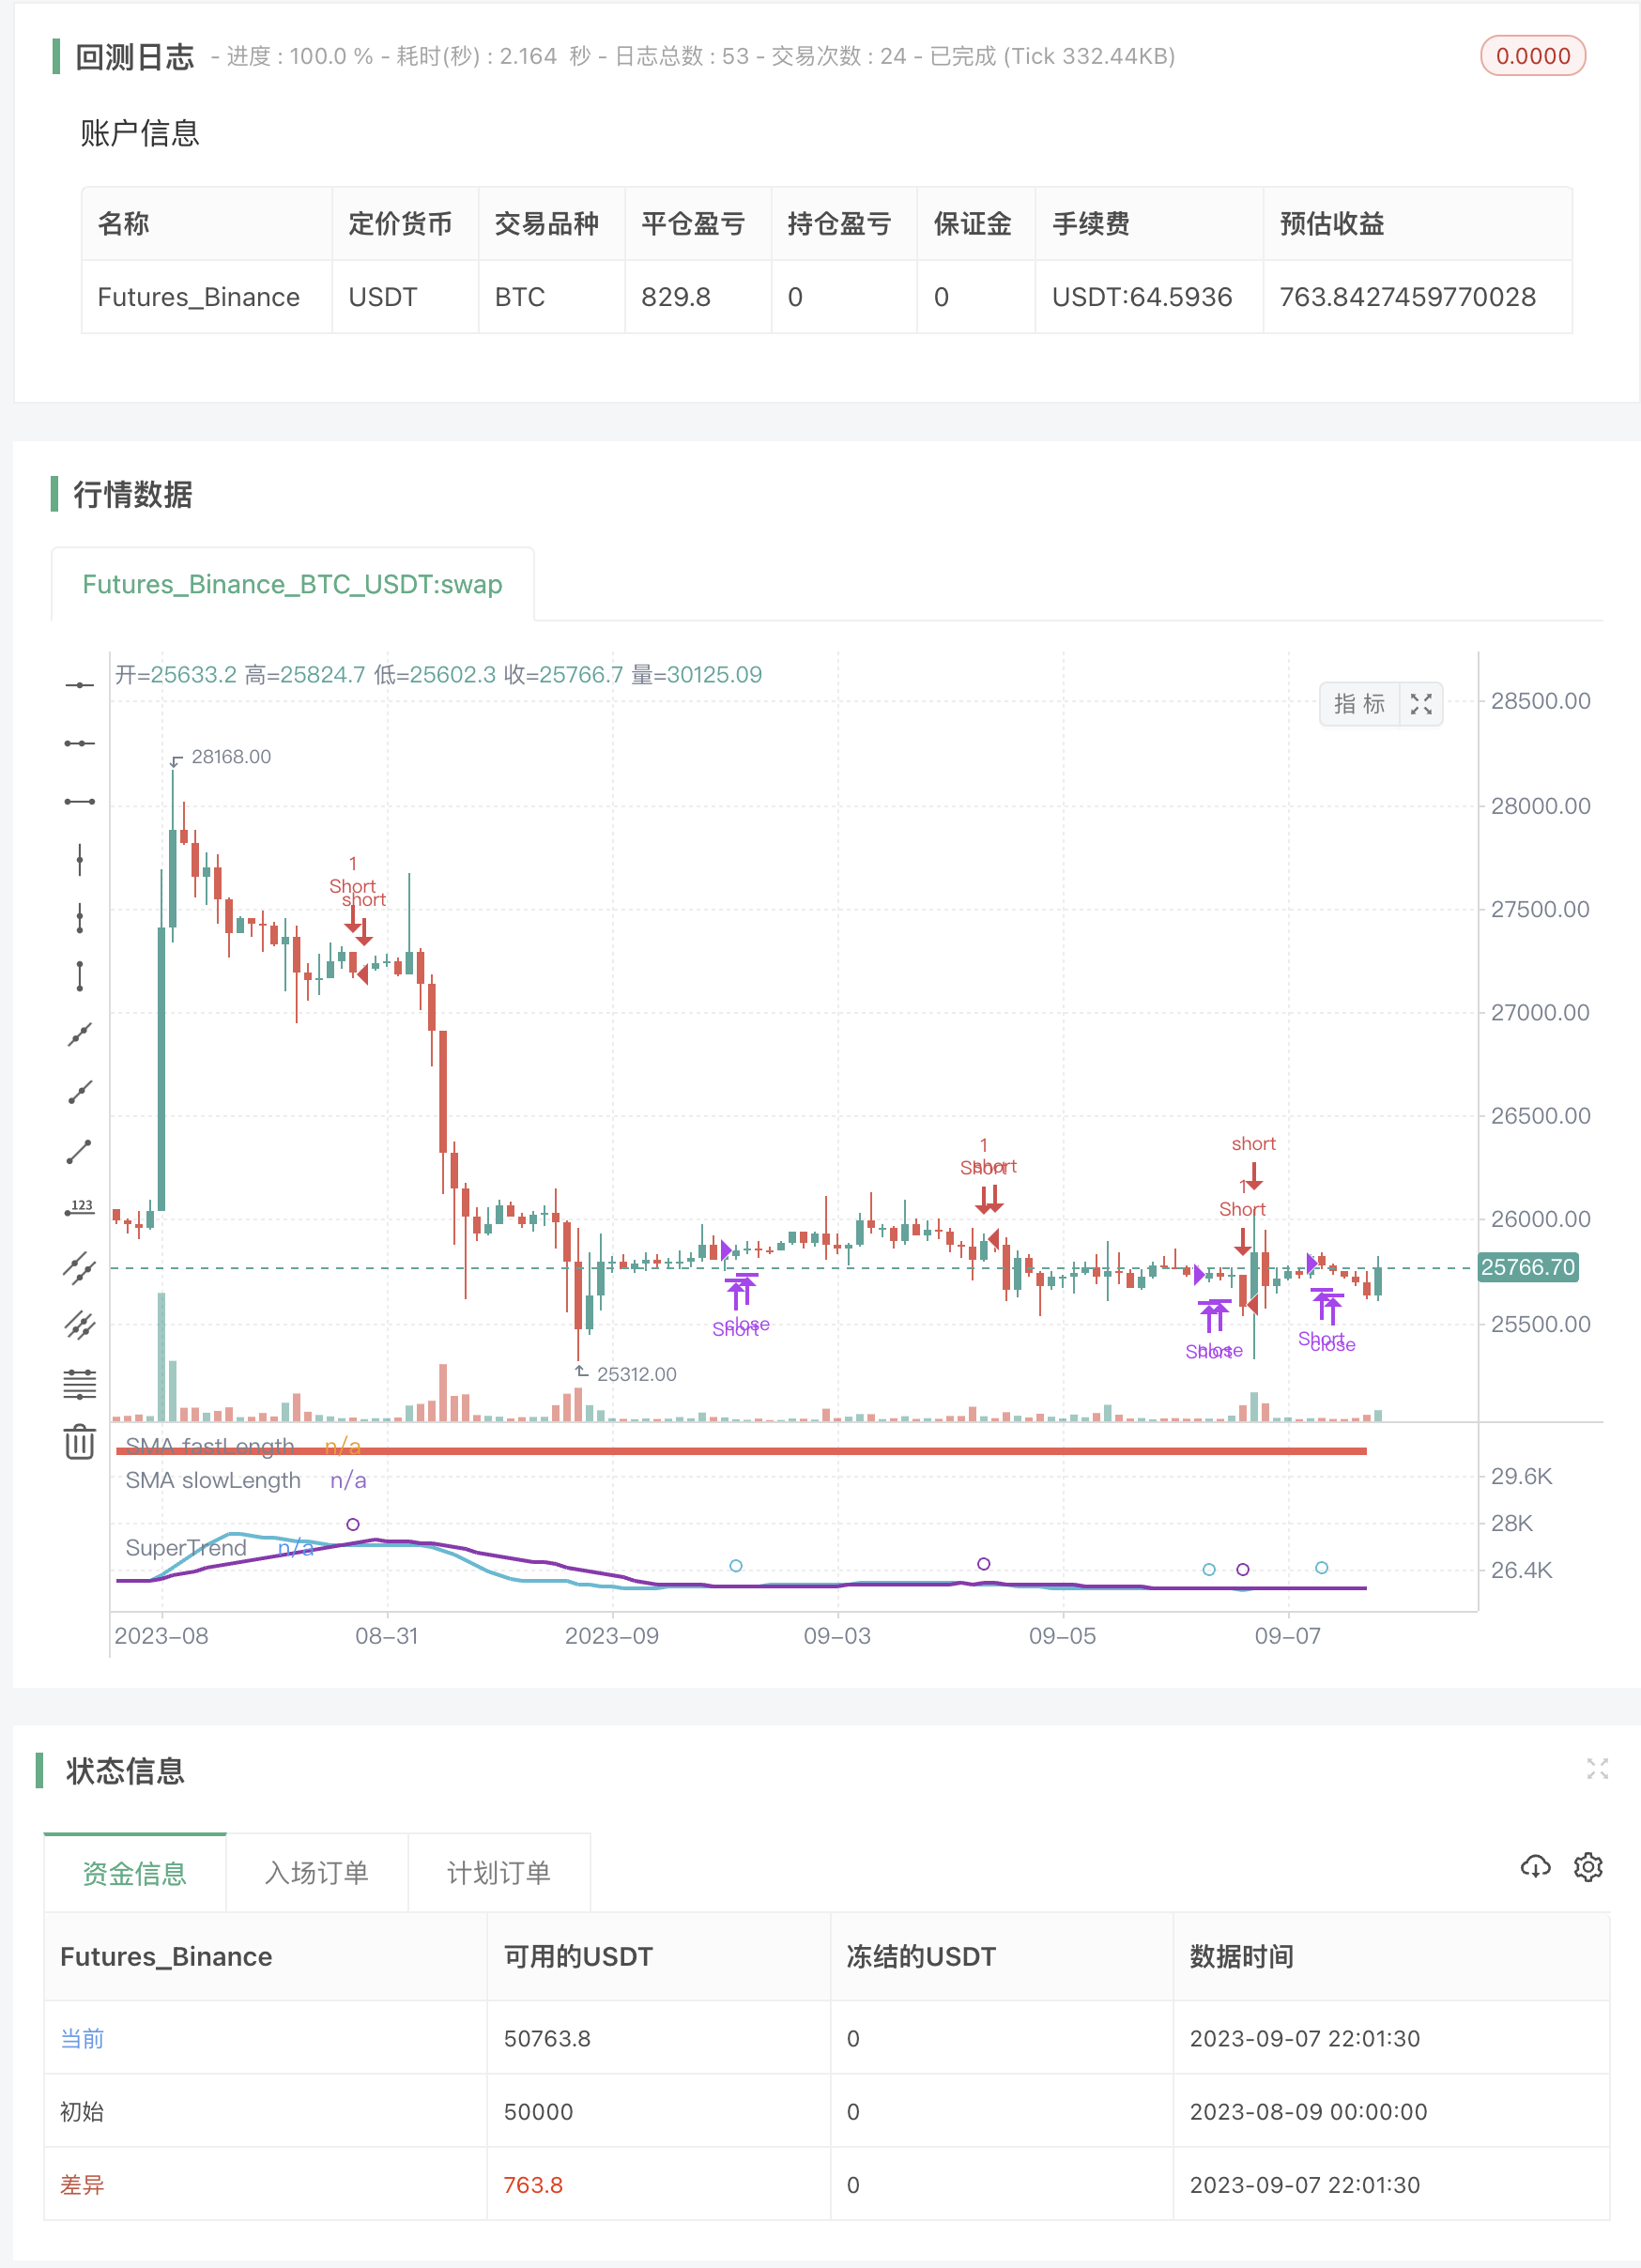 슈퍼트렌드 전략 (Supertrend Strategy) 은 상승 추세와 하락 추세 시장에서 이익을 얻기 위해 사용할 수있는 간단하고 효과적인 거래 전략입니다. 전략은 현재 추세와 잠재적 인 전환점을 식별하는 데 도움이되는 트렌드를 따르는 지표인 슈퍼트렌드 지표에 기반합니다.
베스트 슈퍼트렌드 전략은 표준 슈퍼트렌드 전략의 수정으로 더 높은 인수와 기간을 사용합니다. 이것은 트렌드 변화에 대한 지표를 더 민감하게 만들고 더 수익성있는 거래 기회를 식별하는 데 도움이 될 수 있습니다.
이 전략은 가격이 슈퍼트렌드 라인을 넘을 때 긴 거래를 입력하고 가격이 슈퍼트렌드 라인을 넘을 때 긴 거래를 종료함으로써 작동합니다. 가격이 슈퍼트렌드 라인을 넘을 때 짧은 거래를 입력하고 가격이 슈퍼트렌드 라인을 넘을 때 종료됩니다.
베스트 슈퍼트렌드 전략은 모든 경험 수준의 거래자가 사용할 수있는 간단하고 효과적인 전략입니다. 손실을 제한하기 위해 스톱 손실을 사용하기 때문에 전략은 상대적으로 낮은 위험도 있습니다.
다음은 BEST 슈퍼트렌드 전략을 사용하는 몇 가지 이점입니다.
간단하고 이해하기 쉽다 상승 추세와 하락 추세 시장에서 효과적 낮은 위험 수익성 간단하고 효과적인 거래 전략을 찾고 있다면, BEST 슈퍼트렌드 전략은 훌륭한 옵션입니다. 전략은 배우기 쉽고 사용하기 쉽고, 상승 추세와 하락 추세 시장에서 수익을 창출 할 수있는 잠재력을 가지고 있습니다.
다음은 BEST 슈퍼트렌드 전략을 사용하는 몇 가지 팁입니다.
높은 인수와 기간을 사용 하 여 트렌드 변화에 더 민감한 지표를 만들 수 있습니다. 손실을 제한하기 위해 스톱 손실을 사용합니다. 위험을 관리하기 위해 작은 크기로 거래하십시오. 어떻게 작동하는지 보기 위해 역사적인 데이터에 대한 전략을 테스트합니다. 베스트 슈퍼트렌드 전략은 거래를 시작하는 좋은 방법입니다. 모든 경험 수준의 거래자가 사용할 수있는 간단하고 효과적인 전략입니다. 시장에서 이익을 얻는 방법을 찾고 있다면 베스트 슈퍼트렌드 전략은 훌륭한 옵션입니다.
/*backtest
start: 2023-08-09 00:00:00
end: 2023-09-08 00:00:00
period: 2h
basePeriod: 15m
exchanges: [{"eid":"Futures_Binance","currency":"BTC_USDT"}]
args: [["v_input_4",2]]
*/

//@version=4
//@author=Daveatt

// strategy(title="BEST Supertrend Strategy", shorttitle="Supertrend Strategy", overlay=true,
//  pyramiding=0, default_qty_value=100, precision=7, currency=currency.USD,
//  commission_value=0.2,commission_type=strategy.commission.percent, initial_capital=1000000)


///////////////////////////////////////////////////////////////////////////////
///////////////////////////////////////////////////////////////////////////////
/////////////////////////// Strategy Component /////////////////////////////////
///////////////////////////////////////////////////////////////////////////////
///////////////////////////////////////////////////////////////////////////////

orderType = input("Longs+Shorts",title="What type of Orders", options=["Longs+Shorts","LongsOnly","ShortsOnly"])
isLong   = (orderType != "ShortsOnly")
isShort  = (orderType != "LongsOnly")

// SMA
fastLength = input(7, title="Fast Length SMA")
slowLength = input(20, title="Slow Length SMA")

///////////////////////////////////////////////////////////////////////////////
///////////////////////////////////////////////////////////////////////////////
///////////////////////////// SUPERTREND /////////////////////////////////////
///////////////////////////////////////////////////////////////////////////////
///////////////////////////////////////////////////////////////////////////////

Factor=input(3,title="[ST] Factor", minval=1,maxval = 100, type=input.float)
Pd=input(3, title="[ST] PD", minval=1,maxval = 100)
TF=input("daily", title="Supertrend timeframe", options=["daily","weekly","monthly","quartly","yearly"])

//////////////////////////
//* COLOR CONSTANTS *//
//////////////////////////

AQUA = #00FFFFFF
BLUE = #0000FFFF
RED  = #FF0000FF
LIME = #00FF00FF
GRAY = #808080FF
DARKRED   = #8B0000FF
DARKGREEN = #006400FF
GOLD = #FFD700
WHITE = color.white

// Plots
GREEN_LIGHT     = color.new(color.green, 40)
RED_LIGHT       = color.new(color.red, 40)
BLUE_LIGHT      = color.new(color.aqua, 40)
PURPLE_LIGHT    = color.new(color.purple, 40)


///////////////////////////////////////////////////////////////////////////////
///////////////////////////////////////////////////////////////////////////////
/////////////////////// SUPERTREND DETECTION //////////////////////////////////
///////////////////////////////////////////////////////////////////////////////
///////////////////////////////////////////////////////////////////////////////

f_supertrend(Factor, Pd) =>

    Up=hl2-(Factor*atr(Pd))
    Dn=hl2+(Factor*atr(Pd))

    TrendUp = 0.0
    TrendUp := close[1]>TrendUp[1] ? max(Up,TrendUp[1]) : Up
    TrendDown = 0.0
    TrendDown := close[1]<TrendDown[1]? min(Dn,TrendDown[1]) : Dn
    Trend = 0.0
    Trend := close > TrendDown[1] ? 1: close< TrendUp[1]? -1: nz(Trend[1],1)
    Tsl = Trend==1? TrendUp: TrendDown

    Tsl

st_tsl = f_supertrend(Factor, Pd)

///////////////////////////////////////////////////////////////////////////////
///////////////////////////////////////////////////////////////////////////////
////////////////////////// MULTI TIMEFRAMES CALCS /////////////////////////////
///////////////////////////////////////////////////////////////////////////////
///////////////////////////////////////////////////////////////////////////////


f_securitys(_ticker, _source)=>

    daily = security(_ticker, 'D', _source[1], lookahead=true)
    weekly = security(_ticker, 'W', _source[1], lookahead=true)
    montly = security(_ticker, 'M', _source[1], lookahead=true)
    quarterly = security(_ticker, '3M', _source[1], lookahead=true)
    yearly = security(_ticker, '12M', _source[1], lookahead=true)

    [daily, weekly, montly, quarterly, yearly]


[st_daily, st_weekly, st_monthly, st_quarterly, st_yearly] = f_securitys(syminfo.tickerid, st_tsl)

lapos_x = timenow + round(change(time)*50)
lapos_y = close

down_arrows_text = "▼" + " " + "▼" + " " + "▼" + " " + "▼" + " " + "▼" + " " + "▼" + " " + "▼" + "\n"

// Drawing function designed by RicardoSantos.
f_draw_infopanel(_x, _y, _color, _line, _text)=>
    _rep_text = ""
    for _l = 0 to _line
        _rep_text := _rep_text + "\n"
    _rep_text := _rep_text + _text

    var label _la = na
    label.delete(_la)
    _la := label.new(x=_x, y=_y, text=_rep_text, xloc=xloc.bar_time, yloc=yloc.price,
     color=#C1CADE,  textcolor=_color, size=size.normal)

// Using the JustUncleL reverse order trick
f_draw_infopanel(lapos_x, lapos_y, color.olive,                 12, "╚═══════════════════════╝")
f_draw_infopanel(lapos_x, lapos_y, color.new(color.red, 20),    10,  "Yearly : " + tostring(round(st_yearly)))
f_draw_infopanel(lapos_x, lapos_y, color.new(color.purple, 20), 8,  "Quarterly : " + tostring(round(st_quarterly)))
f_draw_infopanel(lapos_x, lapos_y, color.new(color.green, 20),  6,  "Monthly : " + tostring(round(st_monthly)))
f_draw_infopanel(lapos_x, lapos_y, color.new(color.blue, 20),   4,  "Weekly : " +  tostring(round(st_weekly)))
f_draw_infopanel(lapos_x, lapos_y, color.new(color.green, 20),  2,  "Daily : " +  tostring(round(st_daily)))
f_draw_infopanel(lapos_x, lapos_y, color.olive,                 0,  "╔═════ Supertrend (" + tostring(Factor) + "," + tostring(Pd) + ") ═════╗")

IS_DAILY = TF == "daily"
IS_WEEKLY = TF == "weekly"
IS_MONTHLY = TF == "monthly"
IS_QUARTERLY = TF == "quarterly"
IS_YEARLY = TF == "yearly"

// select right supertrend
st_tsl_TF = iff(IS_DAILY, st_daily,
 iff(IS_WEEKLY, st_weekly,
 iff(IS_MONTHLY, st_monthly,
 iff(IS_QUARTERLY, st_quarterly,
 iff(IS_YEARLY, st_yearly, st_daily)))))


// hard exit
sma_fast = sma(close, fastLength)
sma_slow = sma(close, slowLength)
long_exit     = crossunder(sma_fast,sma_slow)
short_exit    = crossover(sma_fast,sma_slow)

// MA Cross
curr = 0 - barssince(long_exit) + barssince(short_exit)
cross_buy = curr < 0 ?  1 : 0
cross_sell = curr > 0 ? 1  : 0

bull = close >= st_tsl_TF and cross_buy
bear = close <= st_tsl_TF and cross_sell
entry_price = valuewhen(bull or bear, close, 0)

plot(sma_fast, "SMA fastLength", color=color.aqua, linewidth=2)
plot(sma_slow, "SMA slowLength", color=color.purple, linewidth=2)
plotshape(crossover(sma_fast,sma_slow), color=color.aqua, style=shape.circle, size=size.small)
plotshape(crossunder(sma_fast,sma_slow), color=color.purple, style=shape.circle, size=size.small)

// Plot the ST
linecolor = close >= st_tsl_TF ? color.green : color.red
plot(st_tsl_TF, color = linecolor , linewidth = 4,title = "SuperTrend", transp=0)

// Strategy entries/exits
if isLong
    strategy.entry("Long", 1, when=bull)
    strategy.close("Long", when=long_exit)

if isShort
    strategy.entry("Short", 0,  when=bear)
    strategy.close("Short", when=short_exit )
- 상향 트렌드 및 과잉 판매 인덱스 스윙 거래 시스템 전략
- 다항기 회귀를 이용한 양적 트렌드 거래 전략
- 컴보 백테스트 123 리버설 & 상대적인 변동성 지수
- SMA-3 거래 전략
- 볼링거 밴드 자동 거래 전략
- 제네시스 크로스오버 거래 전략
- 총기장단 전략
- 쌍 거래 전략
- 동적 이윤 목표를 가진 오픈 레인지 전략
- 역전 전략의 추진력을 압축
- 반전 시스템
- 적응적 제로 Lag EMA 전략
- BV의 이치모쿠 클라우드
- 상대적 강도 지수 전략
- 볼링거 밴드 + EMA 9
- 단순 EMA20 전략 + 스토카스틱
- NTPC클라이언트 UDP & & 교환 서버 지연
- VWMA + SMA 볼링거 밴드 + RSI 전략: 가격과 부피 상관관계를 분석
- EMA200 및 스토카스틱 RSI 전략
- 트레이드05-K 라인 지원 저항 + ATR 중지