MACD 동적 변동성 교차 예측 전략

1
Follow
1781
Followers
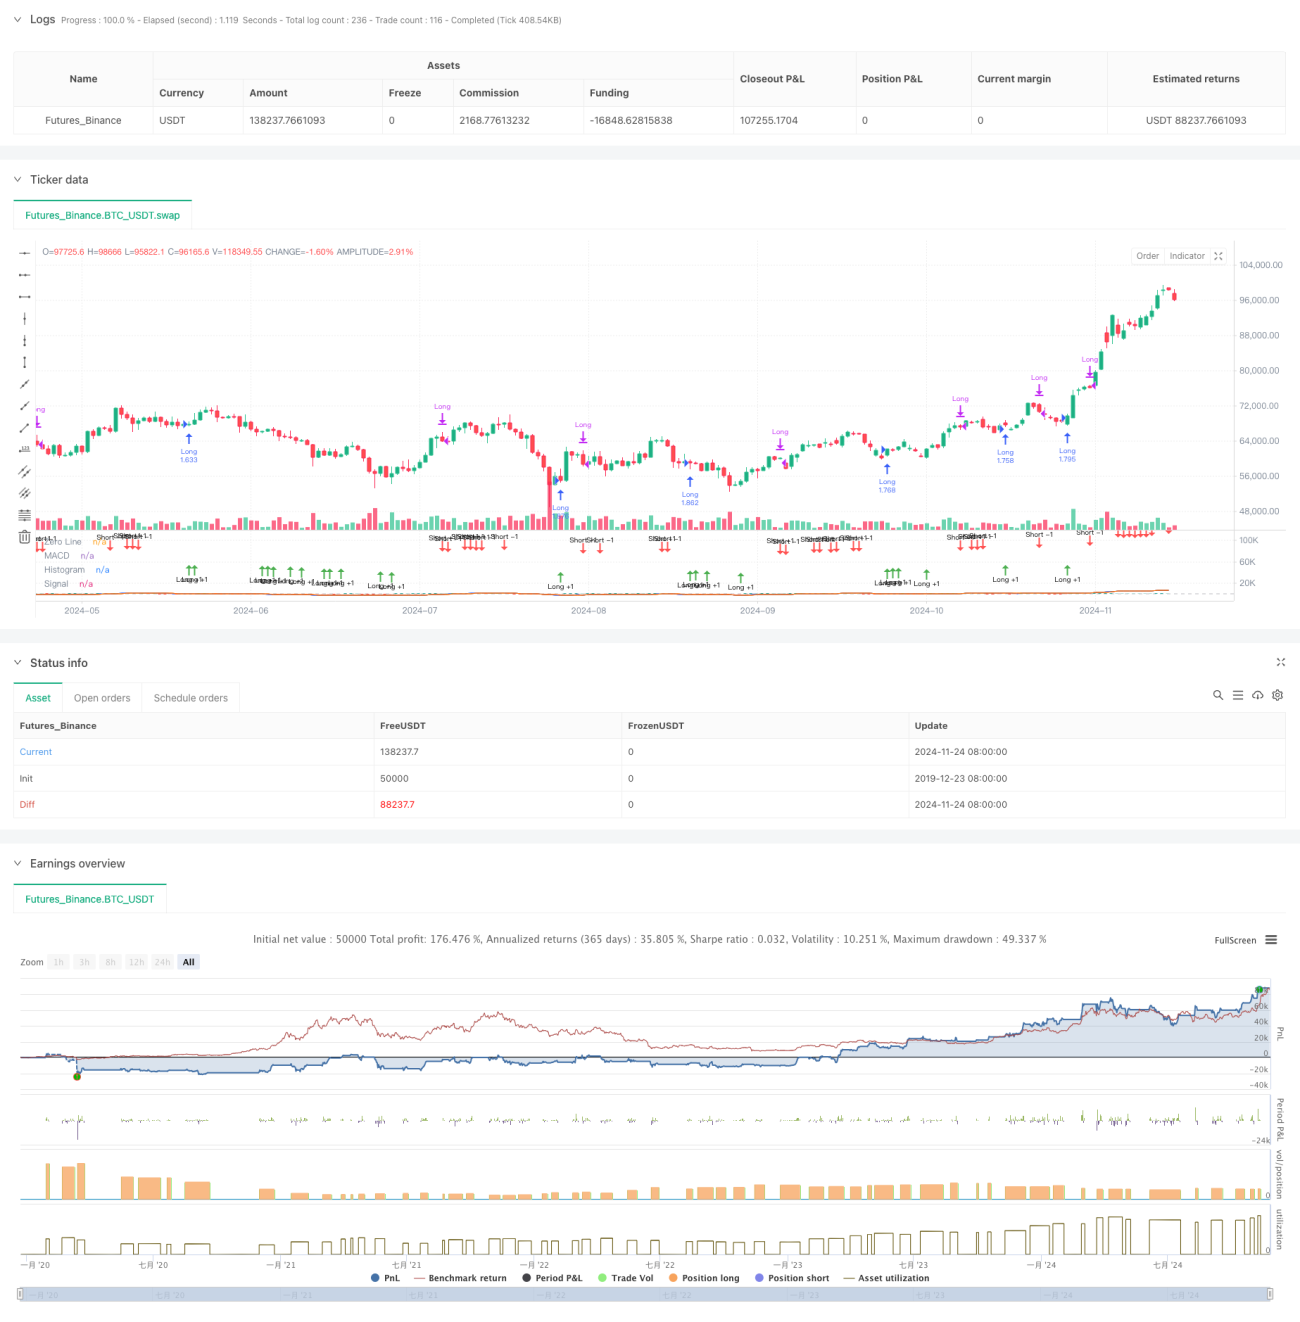
개요
이 전략은 MACD의 동적 변화 특성을 기반으로 거래 결정을 내립니다. 전략의 핵심은 MACD 기둥 모양의 도표를 관찰함으로써 변화하는 경향을 예측하여 발생할 수 있는 금 포크와 사다리 포크를 예측하여 거래를 미리 배열하는 것입니다. 이 전략은 전통적인 MACD 지표 교차 신호뿐만 아니라 기둥 모양의 도표의 동적 변화 특성에 더 집중하여 교차 신호를 미리 판단하여 더 나은 진입 시간을 얻습니다.
전략 원칙
전략은 개선된 MACD 지표 시스템을 사용하여 빠른 이동 평균 ((EMA12) 와 느린 이동 평균 ((EMA26) 의 차차 계산과 2 주기를 기반으로 한 신호 라인을 포함합니다. 핵심 거래 논리는 다음과 같은 몇 가지 핵심 포인트에 기반합니다.
- 기둥 그래프의 변화율 ((hist_change) 을 계산하여 트렌드의 동적인 변화를 판단하는 방법
- 기둥 도표가 마이너스이고 3회 연속으로 상승 추세를 보인다면, 금색 포크 신호가 나타날 수 있으며, 더 많은 돈을 더 빨리 입금할 수 있습니다.
- 기둥 도표가 긍정적이고 3 회 연속으로 하향 추세를 나타낸다면, 사각지대가 발생할 수 있으며, 평형 상태에서 출전할 수 있습니다.
- 전략은 시간 필터링 메커니즘을 도입하여 지정된 시간 범위 내에서만 거래합니다.
전략적 이점
- 신호 예측성: 기둥 모양의 동적 변화를 관찰하여 발생할 수 있는 교차 신호를 미리 예측하여 진입 시기를 효과적으로 향상시킵니다.
- 리스크 관리가 합리적입니다: 0.1%의 수수료와 3 점의 거래 비용이 실제 거래 환경에 적합합니다.
- 재원 관리 유연성: 계좌 총액의 비율을 사용하여 포지션 관리, 위험을 효과적으로 제어
- 시각화 효과 우수함: 다양한 색상 표기된 기둥 모양의 도표와 화살표로 표기된 거래 신호를 사용하여 분석이 용이함
전략적 위험
- 가짜 브레이크 위험: 수평 변동 시장에서 빈번한 가짜 브레이크 신호가 발생할 수 있습니다.
- 지연 위험: 사전 판단 메커니즘이 적용되었지만 MACD 자체는 다소 지연되어 있습니다.
- 시장 환경 의존성: 전략은 추세가 뚜렷한 시장에서 더 잘 작동하며, 불안정한 시장에서는 더 잘 작동하지 않을 수 있습니다.
- 매개 변수 민감성: 빠른 느린 선 주기 설정은 전략 성능에 큰 영향을 미칩니다.
전략 최적화 방향
- 시장 환경 필터 도입: 트렌드 판단 지표를 추가하여 다른 시장 환경에서 다른 거래 매개 변수를 사용할 수 있습니다.
- 포지션 관리를 최적화: 신호 강도에 따라 포지션 비율을 동적으로 조정할 수 있습니다.
- 손해 중지 메커니즘의 개량: 추적 중지 또는 고정 중단을 추가하여 회수 제어
- 신호 확인 메커니즘을 강화: 다른 기술 지표와 함께 상호 검증하여 신호 신뢰성을 향상시킵니다.
- 최적화 매개 변수 선택: 적응 매개 변수 방법을 사용하여 시장 상황에 따라 지표 매개 변수를 동적으로 조정할 수 있습니다.
요약하다
이 전략은 MACD 기둥 도표의 역동적인 변화 특성을 혁신적으로 적용하여 전통적인 MACD 거래 시스템에 대한 개선과 최적화를 실현한다. 전략의 사전 판단 메커니즘은 더 이른 입시 신호를 제공 할 수 있으며, 엄격한 거래 조건과 위험 제어 조치는 전략의 안정성을 보장한다. 이 전략은 더 나은 최적화 및 개선으로 실제 거래에서 더 나은 성능을 기대한다.
Source
Pine
/*backtest
start: 2019-12-23 08:00:00
end: 2024-11-25 08:00:00
period: 1d
basePeriod: 1d
exchanges: [{"eid":"Futures_Binance","currency":"BTC_USDT"}]
*/

//@version=5
strategy(title="Demo GPT - Moving Average Convergence Divergence", shorttitle="MACD", commission_type=strategy.commission.percent, commission_value=0.1, slippage=3, default_qty_type=strategy.percent_of_equity, default_qty_value=100)

// Getting inputsStrategy parameters
Related strategies
Comment
All comments (0)
No data
- 1