
이 전략은 브린지트 및 그라프 형태 분석을 기반으로 한 거래 시스템으로, 일선 레벨의 가격 변동과 그라프 특성을 분석하여 시장 역전 기회를 포착한다. 전략의 핵심은 브린지트의 변동률 채널과 그라프 상의 하향선과 실물과의 비율 관계를 결합하여, 가격이 브린지트 경계에 닿을 때 잠재적인 역전 신호를 찾는다. 이 시스템은 다중 시간 주기의 분석을 지원하며, 일선 레벨 분석을 유지하면서 더 작은 시간 주기에 거래할 수 있다.
이 전략은 20주기의 브린 띠를 주요 기술 지표로 사용하고 있으며, 표준 차이는 2.0이다. 그래프의 상하 그림자 대 실체의 비율을 계산하여, 이 비율이 설정된 임계값 ((비용 1.0) 을 초과하고 가격이 브린 띠 경계에 닿으면, 시스템은 거래 신호를 낸다. 입시 시기는 일일 수령 가격, 다음 날 개시 가격, 일내 최고점 또는 최저점을 유연하게 선택할 수 있다. 이 전략은 또한 계정 잔액을 기반으로 한 위험 관리 시스템을 포함하고 있으며, 포지션 규모를 동적으로 계산하여 각 거래의 위험을 제어한다.
이것은 브린 띠와 차트 분석을 결합한 완전한 거래 시스템으로, 다차원 분석을 통해 시장 역전 기회를 포착한다. 전략의 장점은 전체적인 분석 프레임 워크와 완벽한 위험 관리 시스템이지만, 동시에 시장 환경과 매개 변수 선택이 전략 수행에 미치는 영향에 주의를 기울여야 한다. 제안된 최적화 방향을 통해 전략의 안정성과 신뢰성이 더욱 향상될 전망이다. 실장 응용에서는 먼저 충분한 피드백과 매개 변수 최적화를 수행하고 특정 거래 품종의 특성에 따라 적절한 조정을 수행하는 것이 좋습니다.
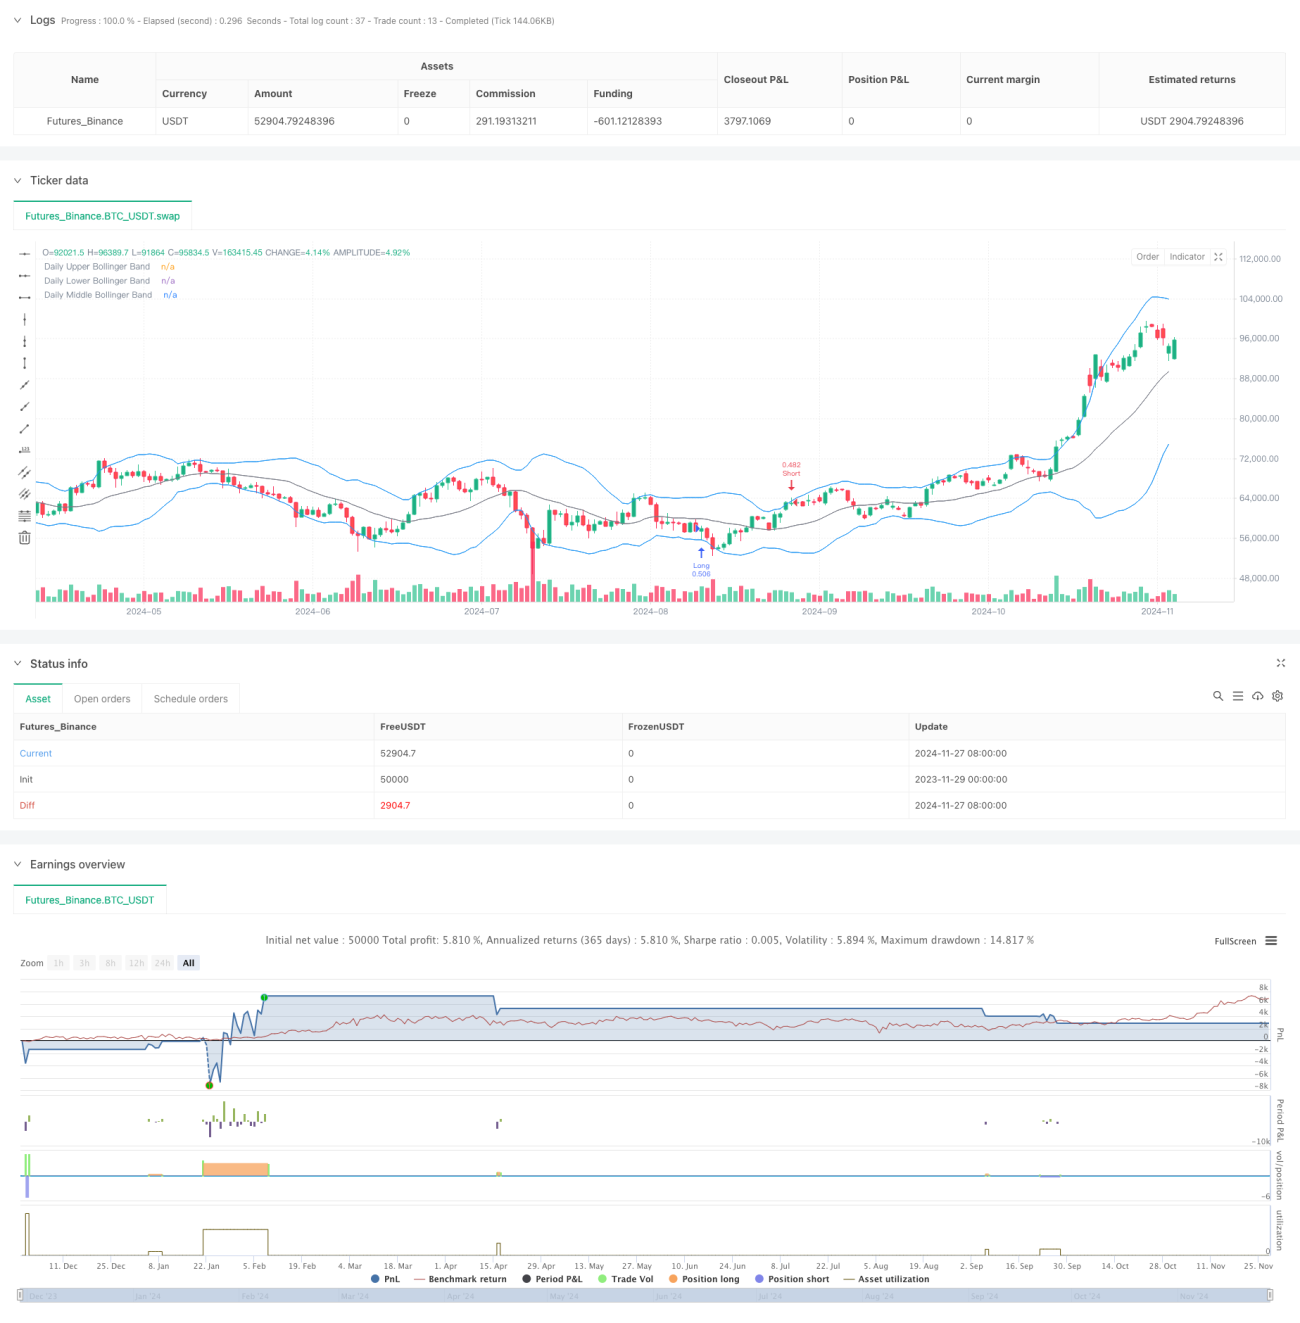
/*backtest
start: 2023-11-29 00:00:00
end: 2024-11-28 00:00:00
period: 1d
basePeriod: 1d
exchanges: [{"eid":"Futures_Binance","currency":"BTC_USDT"}]
*/
//@version=5
strategy("Trade Entry Detector, based on Wick to Body Ratio when price tests Bollinger Bands", overlay=true, default_qty_type=strategy.fixed)
// Input for primary analysis time frame
timeFrame = "D" // Daily time frame
// Bollinger Band settings
length = input.int(20, title="Bollinger Band Length", minval=1)
mult = input.float(2.0, title="Standard Deviation Multiplier", minval=0.1)
source = input(close, title="Source")
// Entry ratio settings
wickToBodyRatio = input.float(1.0, title="Minimum Wick-to-Body Ratio", minval=0)
// Order Fill Timing Option
fillOption = input.string("Daily Close", title="Order Fill Timing", options=["Daily Close", "Daily Open", "HOD", "LOD"])
// Account and risk settings
accountBalance = 100000 // Account balance in dollars
riskPercentage = 1.0 // Risk percentage per trade
riskAmount = (riskPercentage / 100) * accountBalance // Fixed 1% risk amount
// Request daily data for calculations
dailyHigh = request.security(syminfo.tickerid, timeFrame, high)
dailyLow = request.security(syminfo.tickerid, timeFrame, low)
dailyClose = request.security(syminfo.tickerid, timeFrame, close)
dailyOpen = request.security(syminfo.tickerid, timeFrame, open)
// Calculate Bollinger Bands on the daily time frame
dailyBasis = request.security(syminfo.tickerid, timeFrame, ta.sma(source, length))
dailyDev = mult * request.security(syminfo.tickerid, timeFrame, ta.stdev(source, length))
dailyUpperBand = dailyBasis + dailyDev
dailyLowerBand = dailyBasis - dailyDev
// Calculate the body and wick sizes on the daily time frame
dailyBodySize = math.abs(dailyOpen - dailyClose)
dailyUpperWickSize = dailyHigh - math.max(dailyOpen, dailyClose)
dailyLowerWickSize = math.min(dailyOpen, dailyClose) - dailyLow
// Conditions for a candle with an upper wick or lower wick that touches the Bollinger Bands
upperWickCondition = (dailyUpperWickSize / dailyBodySize >= wickToBodyRatio) and (dailyHigh > dailyUpperBand)
lowerWickCondition = (dailyLowerWickSize / dailyBodySize >= wickToBodyRatio) and (dailyLow < dailyLowerBand)
// Define the swing high and swing low for stop loss placement
var float swingLow = na
var float swingHigh = na
if (ta.pivothigh(dailyHigh, 5, 5))
swingHigh := dailyHigh[5]
if (ta.pivotlow(dailyLow, 5, 5))
swingLow := dailyLow[5]
// Determine entry price based on chosen fill option
var float longEntryPrice = na
var float shortEntryPrice = na
if lowerWickCondition
longEntryPrice := fillOption == "Daily Close" ? dailyClose :
fillOption == "Daily Open" ? dailyOpen :
fillOption == "HOD" ? dailyHigh : dailyLow
if upperWickCondition
shortEntryPrice := fillOption == "Daily Close" ? dailyClose :
fillOption == "Daily Open" ? dailyOpen :
fillOption == "HOD" ? dailyHigh : dailyLow
// Execute the long and short entries with expiration
var int longOrderExpiry = na
var int shortOrderExpiry = na
if not na(longEntryPrice)
longOrderExpiry := bar_index + 2 // Order expires after 2 days
if not na(shortEntryPrice)
shortOrderExpiry := bar_index + 2 // Order expires after 2 days
// Check expiration and execute orders
if (longEntryPrice and bar_index <= longOrderExpiry and high >= longEntryPrice)
longStopDistance = close - nz(swingLow, close)
longPositionSize = longStopDistance > 0 ? riskAmount / longStopDistance : na
if (not na(longPositionSize))
strategy.entry("Long", strategy.long, qty=longPositionSize)
longEntryPrice := na // Reset after entry
if (shortEntryPrice and bar_index <= shortOrderExpiry and low <= shortEntryPrice)
shortStopDistance = nz(swingHigh, close) - close
shortPositionSize = shortStopDistance > 0 ? riskAmount / shortStopDistance : na
if (not na(shortPositionSize))
strategy.entry("Short", strategy.short, qty=shortPositionSize)
shortEntryPrice := na // Reset after entry
// Exit logic: hit the opposing Bollinger Band
if (strategy.position_size > 0) // Long position
strategy.exit("Exit Long", "Long", limit=dailyUpperBand)
else if (strategy.position_size < 0) // Short position
strategy.exit("Exit Short", "Short", limit=dailyLowerBand)
if (strategy.position_size > 0) // Long position
strategy.exit("Stop Loss Long", "Long", stop=swingLow)
else if (strategy.position_size < 0) // Short position
strategy.exit("Stop Loss Short", "Short", stop=swingHigh)
// Plot daily Bollinger Bands and levels on the chosen time frame
plot(dailyUpperBand, color=color.blue, linewidth=1, title="Daily Upper Bollinger Band")
plot(dailyLowerBand, color=color.blue, linewidth=1, title="Daily Lower Bollinger Band")
plot(dailyBasis, color=color.gray, linewidth=1, title="Daily Middle Bollinger Band")