
1
Follow
1781
Followers
개요
이 전략은 추세 추적과 시간적 종료 메커니즘을 결합한 양적 거래 전략입니다. 전략의 핵심은 가격과 60일 이동평균선 간의 관계를 관찰하여 시장 동향을 파악하는 동시에, 위험을 통제하기 위해 연말 강제 청산 메커니즘을 도입하는 것입니다. 종가가 60일 이동평균선을 돌파하고 이동평균선의 기울기가 양수이면, 시장에 진입하여 롱 포지션을 취하고 각 연도의 마지막 거래일에 모든 포지션을 청산합니다.
전략 원칙
이 전략은 다음과 같은 핵심 요소를 기반으로 합니다.
- 추세 판단: 60일 간단 이동 평균선(SMA)을 중기 추세 판단 지표로 활용하고, 14일 이동 평균선의 기울기를 계산하여 추세 방향을 확인합니다.
- 진입 신호: 가격이 60일 이동 평균선을 상향 돌파하고 이동 평균선의 기울기가 양수인 경우, 시장이 상승 추세에 진입할 수 있음을 나타내며, 이때 매수 신호가 생성됩니다.
- 종료 메커니즘: 이 전략은 고정 시간 종료 메커니즘을 채택하고 매년 마지막 거래일에 모든 포지션을 마감합니다. 이 메커니즘을 사용하면 수년에 걸쳐 직위를 유지하는 데 따르는 위험을 효과적으로 피할 수 있습니다.
- 거래 시간 관리: 이 전략에는 거래 날짜 범위 제어 및 거래일 판단 기능이 내장되어 있어, 유효한 거래일에만 거래가 수행되도록 보장합니다.
전략적 이점
- 강력한 추세 추적 능력: 이동 평균 시스템은 중기 및 장기 추세를 효과적으로 포착하고 시장 추세 기회를 최대한 활용할 수 있습니다.
- 완벽한 리스크 관리: 연말 강제 청산 메커니즘을 통해 포지션 보유에 따른 리스크를 효과적으로 관리하고, 여러 해에 걸쳐 포지션을 보유함으로써 발생하는 불확실성을 피할 수 있습니다.
- 명확한 운영 규칙: 진입 및 종료 조건이 명확하고 실행 및 백테스트가 쉽습니다.
- 우수한 적응성: 전략 매개변수는 매우 조정 가능하며 다양한 시장 특성에 따라 최적화할 수 있습니다.
전략적 위험
- 이동평균선 히스테리시스: 이동평균선에는 특정 히스테리시스가 있으며, 이로 인해 진입 시점이 약간 지연될 수 있습니다.
- 횡보장이고 변동성이 큰 시장에는 적용되지 않음: 횡보장이고 변동성이 큰 시장에서는 거짓 돌파 신호가 자주 발생할 수 있습니다.
- 고정 청산 위험: 연말에 강제 청산이 발생하면 좋은 추세에서 조기 퇴장이 발생할 수 있습니다.
- 매개변수 민감도: 전략 효과는 이동 평균 기간과 같은 매개변수 설정에 민감합니다.
전략 최적화 방향
- 추세 확인 지표 추가: RSI, MACD와 같은 지표를 도입하여 추세를 판단하고 시장 진입 정확도를 높이는 데 도움을 줄 수 있습니다.
- 종료 메커니즘을 최적화하세요. 손절매 및 이익 실현 조건을 추가하고, 종료를 위해 전적으로 시간에만 의존하지 마세요.
- 동적 조정 매개변수: 이동 평균 기간은 시장 변동성에 따라 동적으로 조정될 수 있습니다.
- 포지션 관리 강화: ATR 등의 포지션 관리 지표를 도입해 자본 사용의 효율성을 개선합니다.
요약하다
이 전략은 추세 추종과 시간 관리를 결합하여 비교적 강력한 거래 시스템을 구축합니다. 전략적 논리는 간단하고 명확하며, 이해하고 구현하기 쉽고 실용성이 좋습니다. 합리적인 매개변수 최적화와 위험 관리 조치의 보완을 통해 이 전략은 실제 거래에서 안정적인 수익을 달성할 것으로 기대됩니다.
Source
Pine
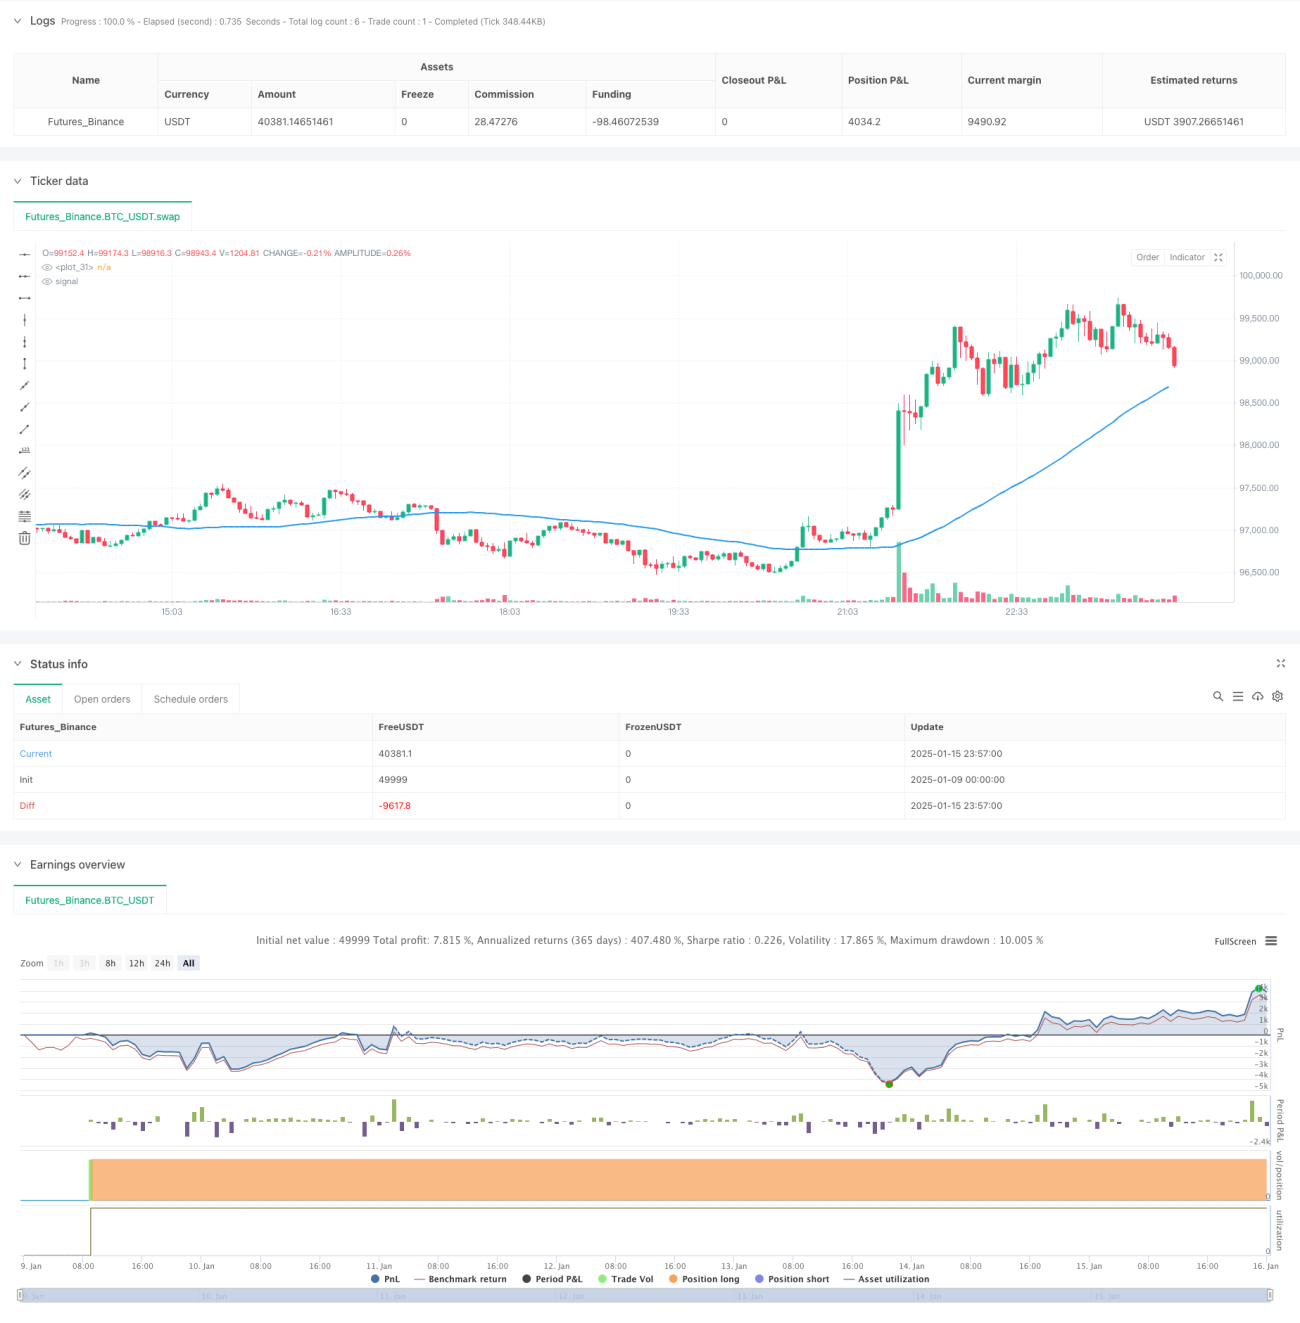
/*backtest
start: 2025-01-09 00:00:00
end: 2025-01-16 00:00:00
period: 3m
basePeriod: 3m
exchanges: [{"eid":"Futures_Binance","currency":"BTC_USDT","balance":49999}]
*/

//@version=5
strategy("Buy above 60-day MA, Sell at year-end", overlay=true, pyramiding=1)

// Define inputs for start and end datesStrategy parameters
Related strategies
Comment
All comments (0)
No data
- 1