EMA 및 캔들스틱 차트를 기반으로 한 추세 거래 전략에 따른 동적 가격

2
Follow
478
Followers
개요
이 전략은 지수 이동 평균 (EMA) 과 <unk> 그래프 형태를 결합한 동적 트렌드 추적 시스템이다. 특정 <unk> 그래프 형태를 식별함으로써 시장의 흐름을 확인하고, 빠른 및 느린 EMA 지표와 결합하여 시장의 변동성을 측정하기 위해 ATR 지표를 사용합니다. 전략의 핵심 아이디어는 시장의 추세가 확인되는 경우, <unk> 그래프 형태를 통해 정확한 진입 시기를 식별하는 것입니다.
전략 원칙
이 전략은 세 가지 핵심 요소로 구성되어 있습니다.
- <unk> 그래프 형태 인식 시스템: 주사 바 형태 ((Pin Bar) 와 흡수 형태 ((Engulfing Pattern) 를 검출한다. 주사 바 형태는 그림자 길이가 개체 길이의 2배 이상인 것을 요구하며, 흡수 형태는 현재 <unk>이 전 <unk>을 완전히 포함하는 개체를 필요로 한다.
- 동적 트렌드 시스템: 8주기 및 21주기 EMA를 사용하여 시장 트렌드를 확인한다. 빠른 EMA가 느린 EMA 위에 있을 때 상승 트렌드를 확인한다. 반대로 하향 트렌드를 확인한다.
- 변동성 모니터링: 14주기 ATR 지표를 사용하여 시장의 변동성을 측정하고 잠재적인 중지 손실 설정에 대한 참조를 제공합니다.
진입 조건은 엄격하게 트렌드와 형태를 함께 확인하는 것을 요구합니다: 다중 입장은 시장이 상승 추세에있는 동시에 다중 <unk> 차트 형태를 볼 필요가 있습니다. 공허 입장은 시장이 하락 추세에있는 동시에 공허 <unk> 차트 형태를 볼 필요가 있습니다.
전략적 이점
- 다중 확인 메커니즘: 트렌드 지표와 형태 지표를 결합하여 가짜 신호의 가능성을 줄인다.
- 동적 적응성: EMA와 ATR과 같은 동적 지표를 사용하여 전략이 다른 시장 환경에 적응할 수 있도록 한다.
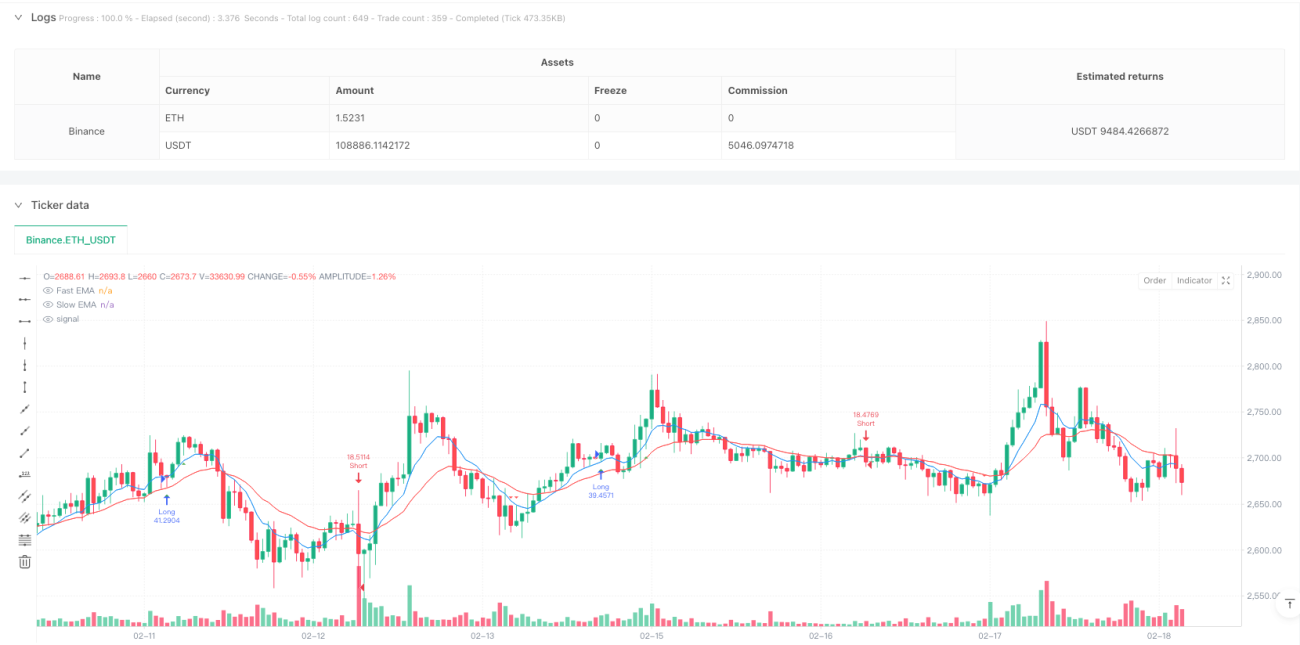
- 명확한 시각적 피드백: 전략은 차트에 입문 신호와 트렌드 라인을 표시하여 거래자가 시장 상황을 직관적으로 이해할 수 있도록합니다.
- 구조화된 코드 설계: 전략 코드 조직이 명확하여 후속 유지 및 최적화를 용이하게 한다.
전략적 위험
- 손해 중지 장치의 부재: 현재 버전은 자동 손해 중지 기능을 구현하지 않으며, 수동으로 위험을 관리해야 합니다.
- 트렌드 의존성: 흔들리는 시장에서 빈번하게 잘못된 신호가 발생할 수 있다.
- 지연 위험: 지연 지표로서의 EMA는 입학 시기를 약간 지연시킬 수 있다.
- 과도한 민감성: 특정 시장 조건에서 형상 인식이 너무 자주 발생할 수 있습니다.
전략 최적화 방향
- 손해 차단 메커니즘을 도입: ATR을 기반으로 설계된 다이내믹 손해 차단 시스템을 도입하는 것이 좋습니다.
- 필터 추가: 가짜 신호를 줄이기 위해 거래량 확인이나 다른 기술 지표를 추가할 수 있다.
- 최적화 매개 변수: EMA와 ATR의 주기는 다른 거래 품종과 시간 주기에 따라 최적화 될 수 있다.
- 포지션 관리: 변동성에 기반한 동적 포지션 관리 시스템을 구현한다.
요약하다
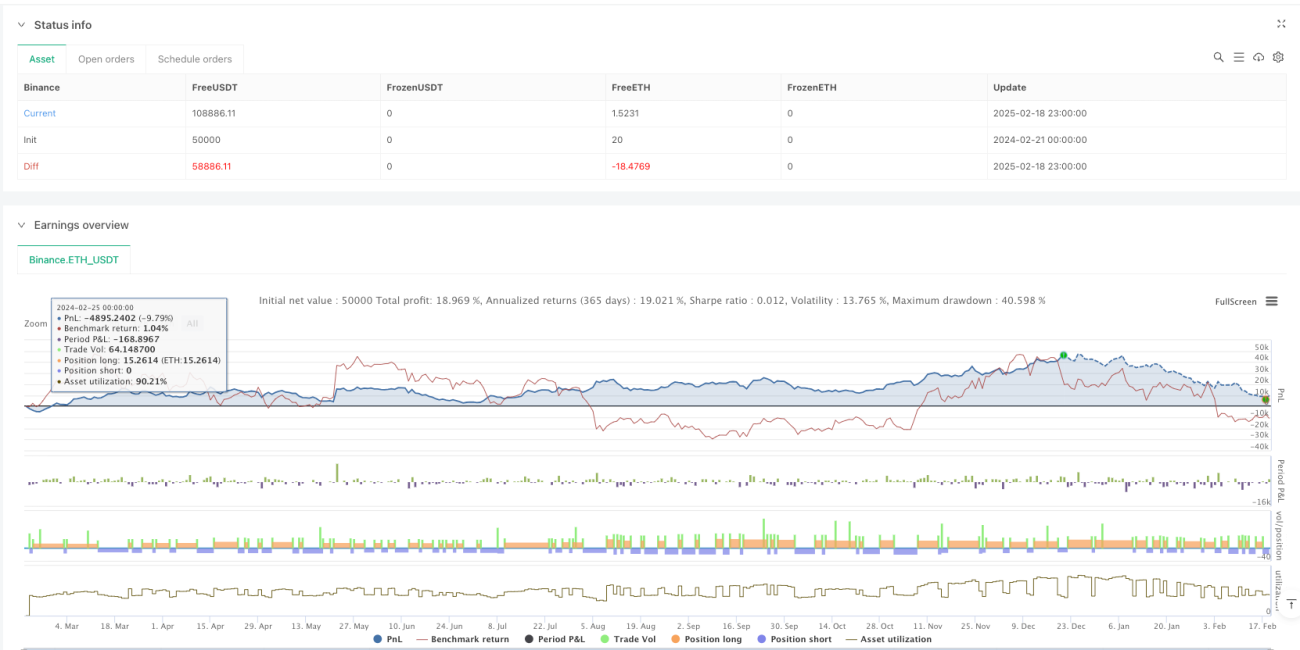
이것은 잘 구성된 트렌드 추적 전략으로, 여러 가지 기술적 분석 도구를 결합하여 비교적 신뢰할 수있는 거래 시스템을 제공합니다. 현재의 버전에는 개선해야 할 부분이 있지만, 핵심 논리는 합리적입니다. 권장된 최적화 조치를 실행하면이 전략은 더 나은 거래 시스템으로 발전할 가능성이 있습니다. 특히 트렌딩 시장에서 전략은 더 잘 작동 할 수 있습니다.
Source
Pine
/*backtest
start: 2024-02-21 00:00:00
end: 2025-02-19 00:00:00
period: 1h
basePeriod: 1h
exchanges: [{"eid":"Binance","currency":"ETH_USDT"}]
*/

//@version=6
strategy("Candlestick Bible: Dynamic Price Follower (Corrected)", overlay=true, pyramiding=0, initial_capital=10000, default_qty_type=strategy.percent_of_equity, default_qty_value=100)

//=======================Related strategies
Comment
All comments (0)
No data
- 1