
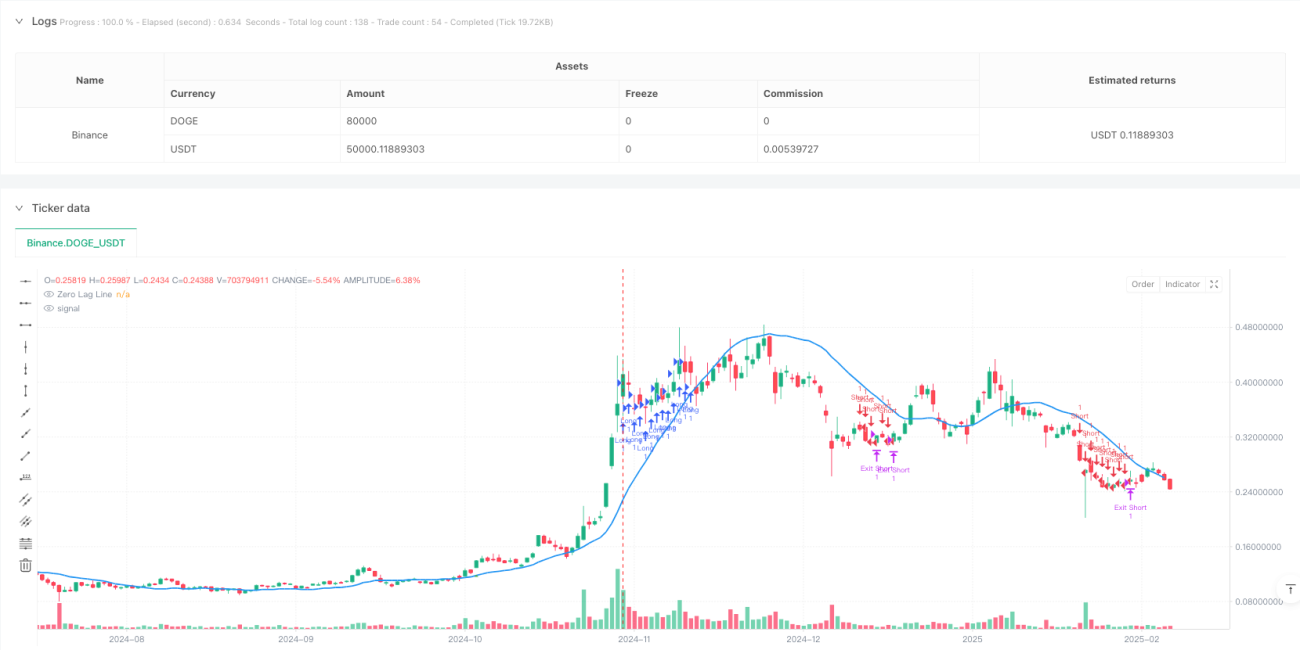
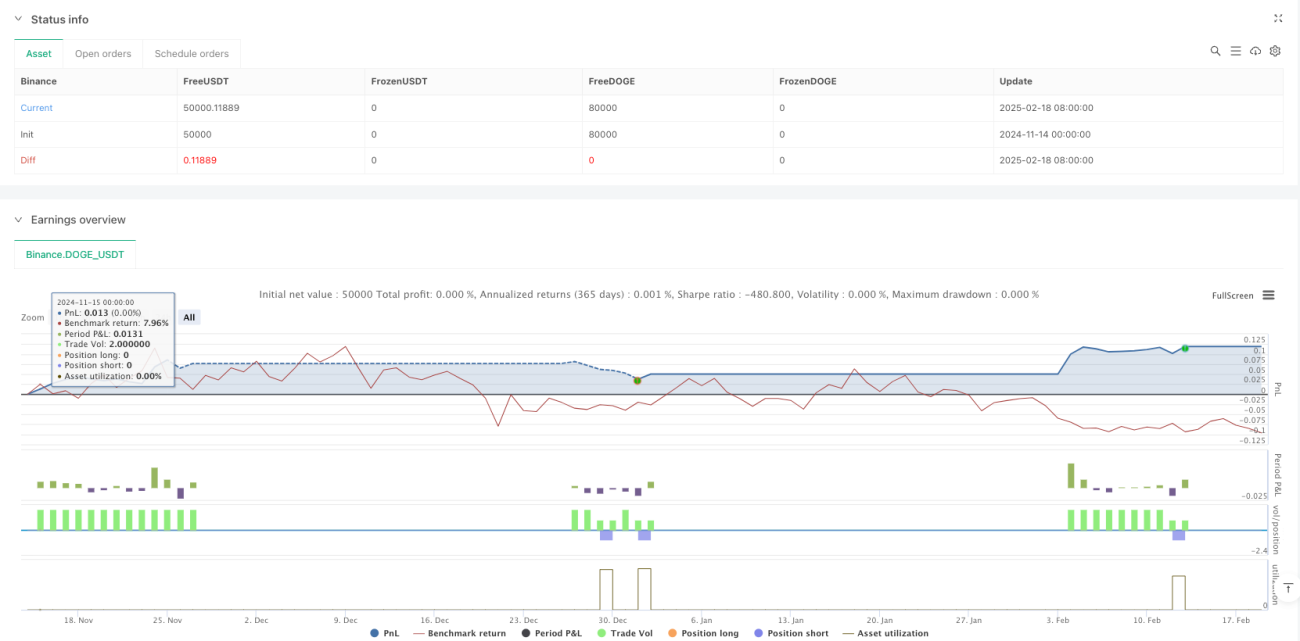
이 전략은 제로 지연 이동 평균과 트렌드 강도 스코어에 기반한 정량 거래 시스템이다. 그것은 전통적인 이동 평균의 지연성을 제거하고, 변동률 채널과 트렌드 강도 스코어와 결합하여 시장의 추세를 식별하여 가격의 중·단기 변동 기회를 포착한다. 이 전략은 양방향 거래 모드를 채택하고, 상승 추세에서 더하고, 하향 추세에서 공백하고, 위험을 제어하기 위해 스톱포드를 설정한다.
전략의 핵심은 0 지연 이동 평균을 사용하여 전통적인 이동 평균의 지연 효과를 제거하는 것입니다. 구체적인 구현 방법은: 먼저 현재 가격과 지연 가격의 차이를 계산하고, 그 차이를 현재 가격과 더하고, 마지막으로 결과를 이동 평균으로 계산합니다. 동시에, 전략은 트렌드 강도 점수 시스템을 도입하여 다른 시간 주기에서의 가격 상승과 하락을 비교하여 트렌드 강도를 정량화합니다. 또한, 전략은 ATR 기반의 동적 변동율 채널을 설정하여 거래 신호를 뚫고 거래합니다.
이 전략은 혁신적인 제로 지연 계산 방법과 트렌드 강도 점수 시스템을 통해 전통적인 트렌드 추적 전략의 지연 문제를 잘 해결했습니다. 동시에, 동적 변동율 통로와 완벽한 위험 제어 장치를 도입하여 전략의 안정성과 신뢰성을 높였습니다. 전략은 파라미터 최적화 및 시장 적응성 측면에서 개선 할 여지가 있지만, 전체적인 설계 아이디어는 명확하고 실전 가치 적용이 좋습니다. 거래자는 실제 사용 시 특정 시장 특성과 거래 지표의 특성에 따라 적절한 파라미터 조정을 할 것을 권장합니다.
/*backtest
start: 2024-11-14 00:00:00
end: 2025-02-19 08:00:00
period: 1d
basePeriod: 1d
exchanges: [{"eid":"Binance","currency":"DOGE_USDT"}]
*/
// This Pine Script™ code is subject to the terms of the Mozilla Public License 2.0 at https://mozilla.org/MPL/2.0/
// © josephdelvecchio
//@version=6
strategy("Zero Lag Trend Strategy", overlay=true)
// -- Input Parameters --
timeframe = input.timeframe("10", "Timeframe")
zeroLagMovAvg = input.string("ema", "Zero Lag Moving Average", options=["ema", "sma"])
length = input.int(50, "Lookback Period")
volatility_mult = input.float(1.5, "Volatility Multiplier")
loop_start = input.int(1, "Loop Start")
loop_end = input.int(50, "Loop End")
threshold_up = input.int(5, "Threshold Up")
threshold_down = input.int(-5, "Threshold Down")
signalpct = input.float(8, "Signal Percentage")
stoppct = input.float(0, "Stop Percentage")
// -- Helper Variables --
nATR = ta.atr(length)
lag = math.floor((length - 1) / 2)
zl_basis = zeroLagMovAvg == "ema" ? ta.ema(2 * close - close[lag], length) : ta.sma(2 * close - close[lag], length)
volatility = ta.highest(nATR, length * 3) * volatility_mult
// -- Trend Strength Scoring Function --
forloop_analysis(basis_price, loop_start, loop_end) =>
int sum = 0 // Use 'sum' as you did originally, for the +/- logic
for i = loop_start to loop_end
if basis_price > basis_price[i]
sum += 1
else if basis_price < basis_price[i] // Explicitly check for less than
sum -= 1
// If they are equal, do nothing (sum remains unchanged)
sum
score = forloop_analysis(zl_basis, loop_start, loop_end)
// -- Signal Generation --
long_signal = score > threshold_up and close > zl_basis + volatility
short_signal = score < threshold_down and close < zl_basis - volatility
// -- Trend Detection (Ensure One Trade Until Reversal) --
var int trend = na
trend := long_signal ? 1 : short_signal ? -1 : trend[1]
trend_changed = trend != trend[1]
// -- Stop-Loss & Take-Profit --
stop_loss = close * (1 - stoppct / 100)
take_profit = close * (1 + signalpct / 100)
// -- Strategy Orders (Enter Only When Trend Changes) --
if long_signal
strategy.entry("Long", strategy.long)
else if short_signal
strategy.entry("Short", strategy.short)
// -- Strategy Exits --
strategy.exit("Exit Long", from_entry="Long", stop=stop_loss, limit=take_profit)
strategy.exit("Exit Short", from_entry="Short", stop=take_profit, limit=stop_loss)
// -- Visualization --
p_basis = zl_basis
plot(p_basis, title="Zero Lag Line", color=color.blue, linewidth=2)
// -- Buy/Sell Arrows --
plotshape(series=trend_changed and trend == 1, location=location.belowbar, color=color.green, style=shape.triangleup, size=size.large, title="Buy Signal")
plotshape(series=trend_changed and trend == -1, location=location.abovebar, color=color.red, style=shape.triangledown, size=size.large, title="Sell Signal")