개요
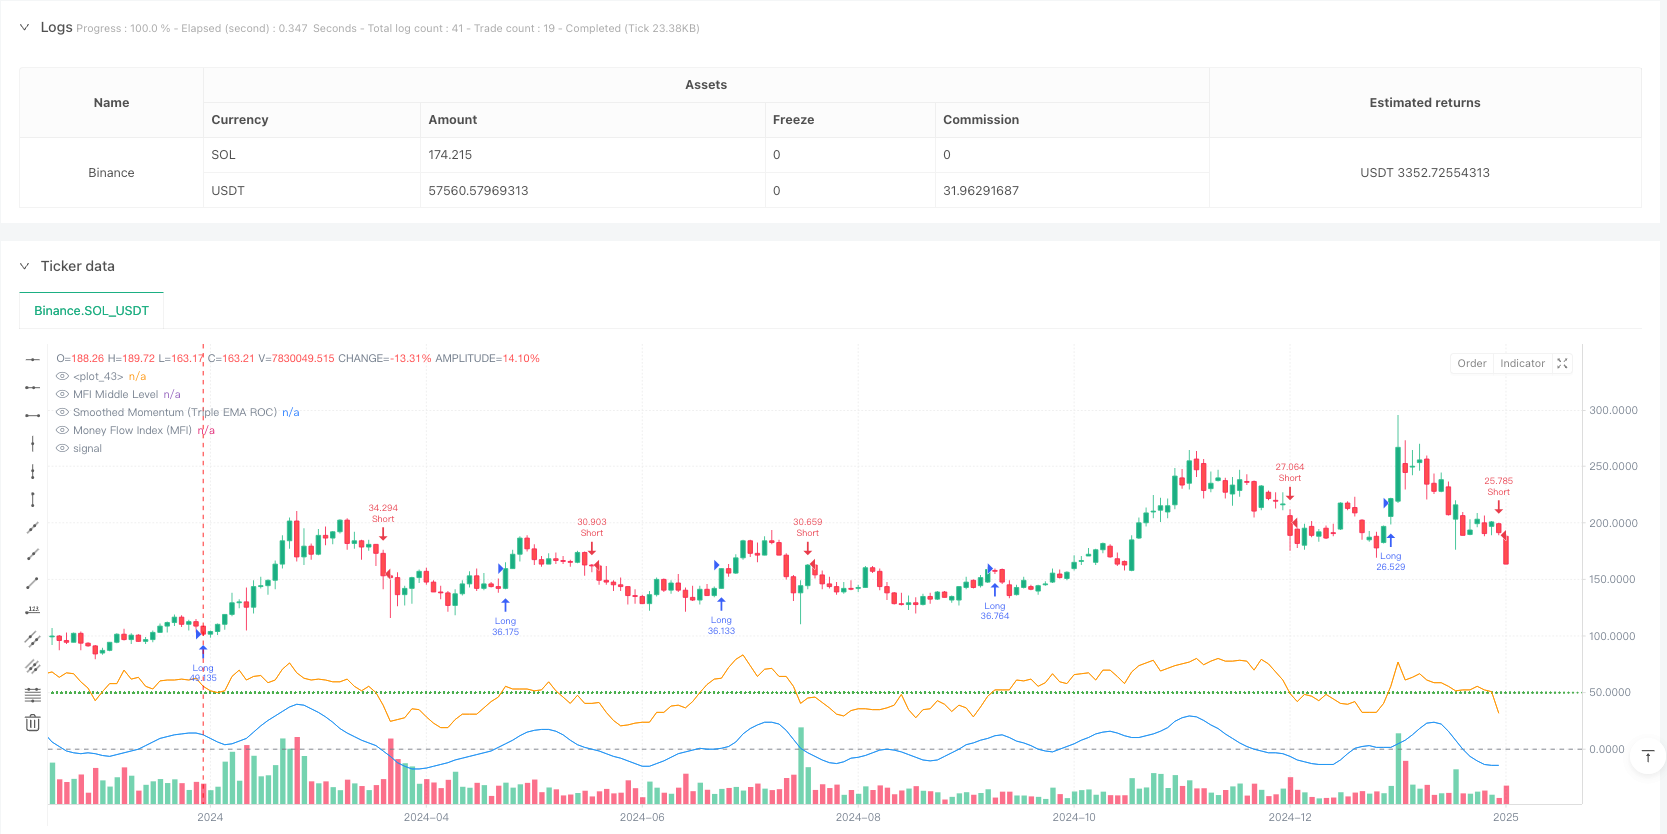
이 전략은 운동량 지표와 자금 흐름 지표를 결합한 통합 거래 시스템으로, 삼중 지수 이동 평균 ((EMA) 에 대한 운동량 지표에 대한 부드러운 처리를 통해 시장 소음을 효과적으로 줄인다. 전략은 변화율 ((ROC) 을 사용하여 원시 운동량을 계산하고 통화 흐름 지표 ((MFI) 와 결합하여 거래 신호를 확인합니다.
전략 원칙
전략의 핵심 원칙은 두 가지 주요 기술 지표에 기반합니다: 동력 지표와 자금 흐름 지표 (MFI). 먼저 ROC를 사용하여 원시 동력을 계산하고, 다음에는 트리플 EMA 평준화 처리를 통해 더 안정적인 동력 신호 라인을 얻습니다. 거래 신호의 발생은 동력과 MFI의 조건을 동시에 충족해야합니다. 평준화 후 동력이 긍정적이고 MFI가 중간 수준보다 높을 때 여러 신호가 발생하며, 평준화 후 동력이 부정적이며 MFI가 중간 수준보다 낮은 수준에서 발생하면 빈 신호가 발생합니다. 전략은 동력 및 MFI 점 기반의 탈퇴 메커니즘을 설계하여 적시에 손실을 멈추고 이익을 잠금하는 데 도움이됩니다.
전략적 이점
- 신호 부드러움: 트리플 EMA 처리를 통해 가짜 신호를 현저히 줄이고 거래의 신뢰성을 향상시킵니다.
- 이중 확인 메커니즘: 동력과 자금 흐름의 두 차원을 결합하여 단일 지표의 한계를 줄입니다.
- 광범위하게 적용 가능: 다양한 시간대에 적용할 수 있으며, 강력한 보편성을 가지고 있다
- 리스크 관리가 잘 이루어져 있습니다. 명확한 입출장 조건과 손해 방지 장치가 포함됩니다.
- 변수 조정성: 다양한 시장 상황에 따라 최적화할 수 있도록 다양한 변수를 제공합니다.
전략적 위험
- 트렌드 리버스 위험: 급격한 변동 시장에서 신호 지연이 발생할 수 있습니다.
- 변수 민감성: 다른 변수 설정으로 인해 정책 성능에 큰 차이가 발생할 수 있습니다.
- 시장 환경 의존: 수평 시장에서 빈번하게 잘못된 신호가 발생할 수 있습니다.
- 자금 관리 위험: 위험을 통제하기 위해 포지션 규모를 합리적으로 설정해야 합니다.
- 기술 지표의 한계: 기술 지표에 기반한 전략은 근본적인 변화로 인해 실패할 수 있습니다.
전략 최적화 방향
- 진동율 필터를 도입: ATR 지표를 추가하여 낮은 진동 기간의 신호를 필터링한다
- 탈퇴 메커니즘을 최적화: 이동성 손실 및 수익 목표를 높여
- 시간 필터링: 중요한 경제 데이터 발표를 피하는 방법
- 트랜지먼트 확인을 추가: 트랜지먼트 분석을 결합하여 신호 신뢰성을 향상시킵니다.
- 적응 파라미터를 개발: 시장 상황에 따라 동적으로 조정하는 파라미터
요약하다
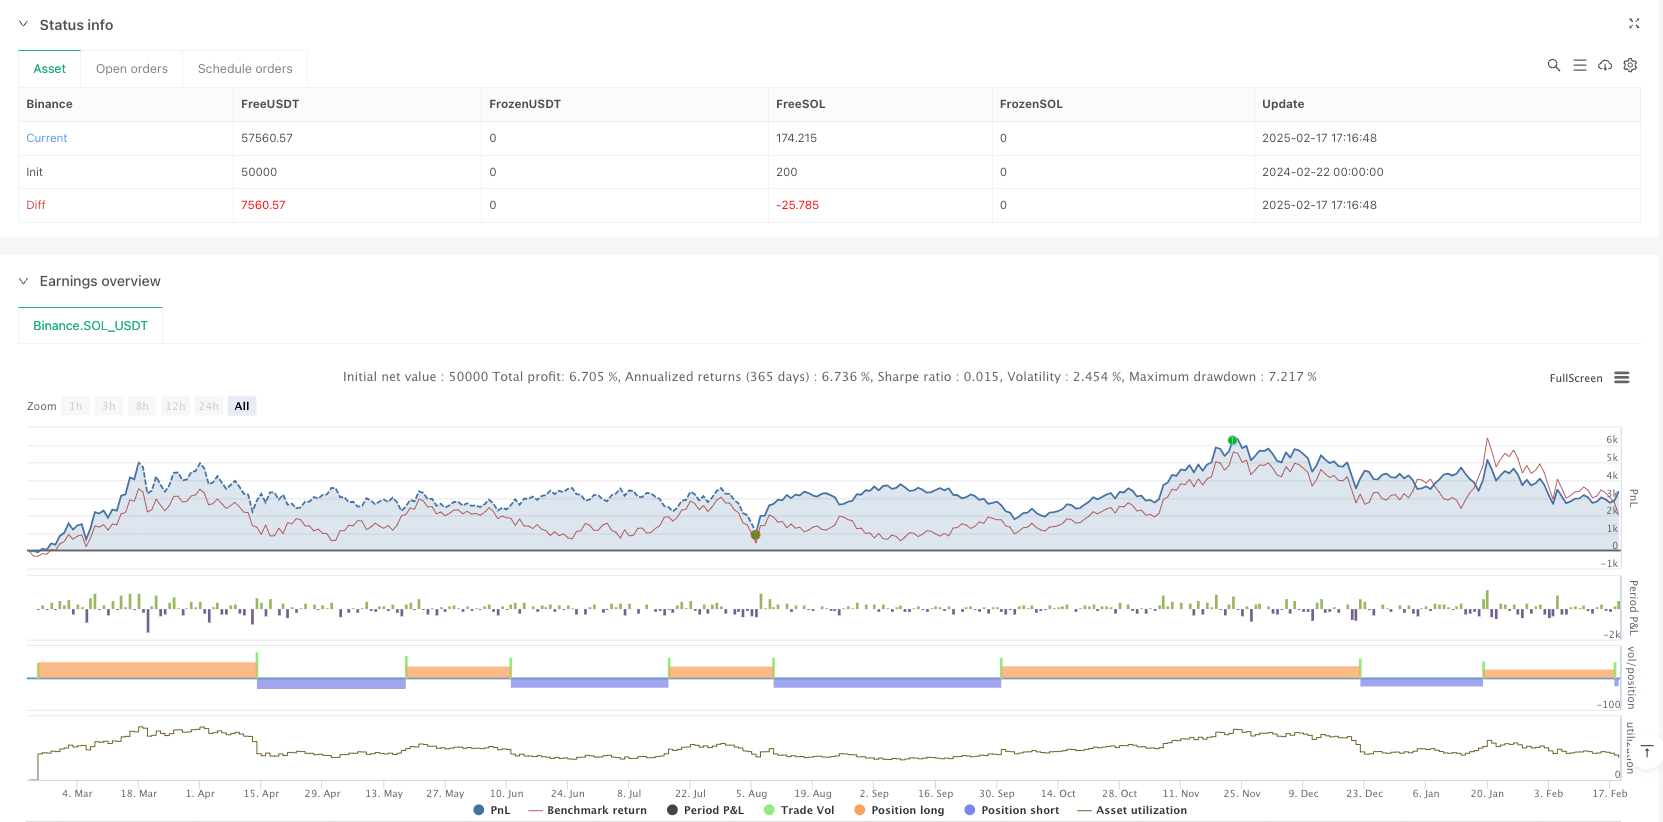
이것은 합리적이고 논리적으로 명확하게 설계된 통합 거래 전략이다. 동력과 자금 흐름 지표의 결합과 삼중 EMA의 부드러운 처리를 통해 신호의 시기적절성과 신뢰성을 효과적으로 균형 잡는다. 전략은 더 나은 최적화와 실내 응용에 적합한 강력한 실용성과 확장성을 가지고 있다. 거래자는 실제 응용에서 위험 제어에 주의를 기울이고, 합리적으로 매개 변수를 설정하고, 시장의 특정 상황에 따라 최적화 조정할 것을 권장한다.
전략 소스 코드
/*backtest
start: 2024-02-22 00:00:00
end: 2025-02-19 08:00:00
period: 2d
basePeriod: 2d
exchanges: [{"eid":"Binance","currency":"SOL_USDT"}]
*/

//@version=5
strategy("Momentum & Money Flow Strategy with Triple EMA Smoothing", overlay=true, initial_capital=100000, default_qty_type=strategy.percent_of_equity, default_qty_value=10)

// Input parameters
momentumPeriod  = input.int(7, title="Momentum Period", minval=1)
smoothingPeriod = input.int(3, title="Momentum Smoothing Period", minval=1)
mfiPeriod       = input.int(14, title="MFI Period", minval=1)
mfiMiddleLevel  = input.int(50, title="MFI Middle Level", minval=1, maxval=100)
mfiOverbought   = input.int(80, title="MFI Overbought Level", minval=1, maxval=100)
mfiOversold     = input.int(20, title="MFI Oversold Level", minval=1, maxval=100)

// Calculate raw momentum oscillator using rate-of-change (ROC)
rawMomentum = ta.roc(close, momentumPeriod)
// Apply triple EMA smoothing for a much smoother momentum line
smoothedMomentum = ta.ema(ta.ema(ta.ema(rawMomentum, smoothingPeriod), smoothingPeriod), smoothingPeriod)

// Calculate Money Flow Index (MFI) using the typical price (hlc3)
typicalPrice = hlc3
mfiValue     = ta.mfi(typicalPrice, mfiPeriod)

// Define conditions for filtering signals based on smoothed momentum and MFI
longCondition  = (smoothedMomentum > 0) and (mfiValue > mfiMiddleLevel)
shortCondition = (smoothedMomentum < 0) and (mfiValue < mfiMiddleLevel)

// Define exit conditions for capturing turning points
exitLongCondition  = (smoothedMomentum < 0) and (mfiValue < mfiOversold)
exitShortCondition = (smoothedMomentum > 0) and (mfiValue > mfiOverbought)

// Execute entries based on defined conditions
if (longCondition and strategy.position_size <= 0)
    strategy.entry("Long", strategy.long)
if (shortCondition and strategy.position_size >= 0)
    strategy.entry("Short", strategy.short)

// Exit positions based on turning point conditions
if (strategy.position_size > 0 and exitLongCondition)
    strategy.close("Long")
if (strategy.position_size < 0 and exitShortCondition)
    strategy.close("Short")

// Plot the triple EMA smoothed momentum oscillator and MFI for visual reference
plot(smoothedMomentum, title="Smoothed Momentum (Triple EMA ROC)", color=color.blue)
hline(0, color=color.gray)
plot(mfiValue, title="Money Flow Index (MFI)", color=color.orange)
hline(mfiMiddleLevel, color=color.green, linestyle=hline.style_dotted, title="MFI Middle Level")