
2
Follow
478
Followers
개요
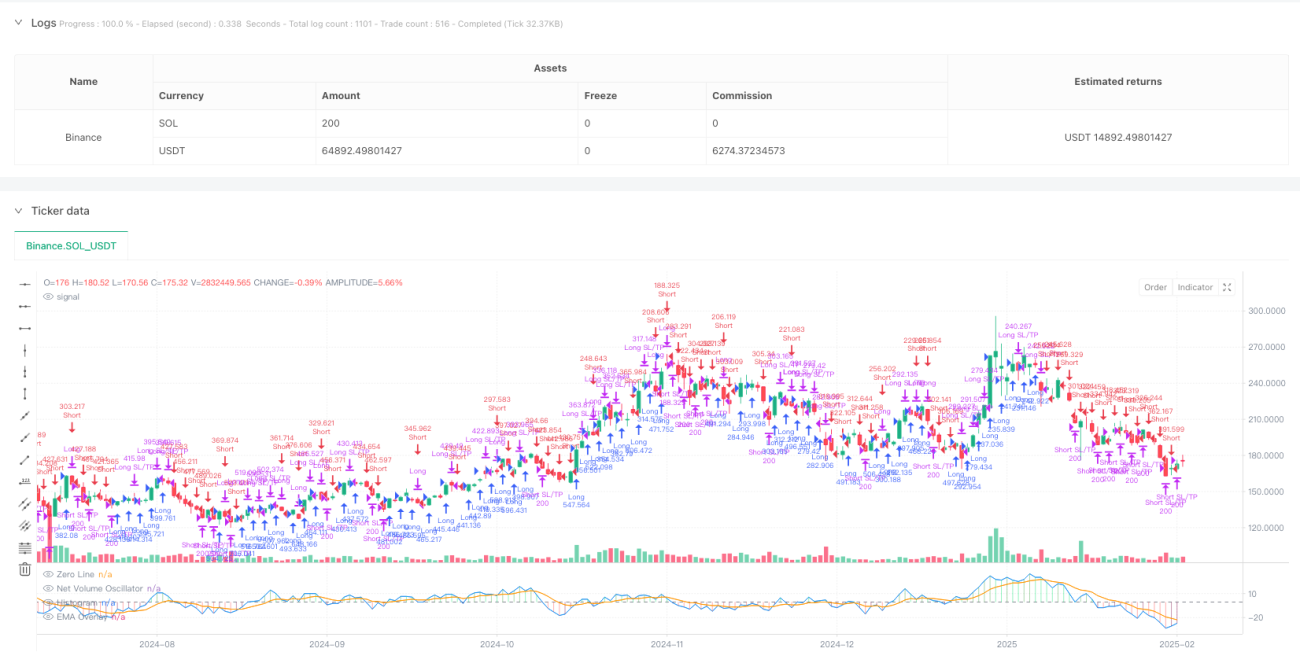
이 전략은 거래량과 가격 변화에 기반한 트렌드 추적 시스템으로, 순 거래량 흔들림 지표 ((NVO) 를 계산하여 시장의 방향을 예측한다. 이 전략은 여러 가지 이동 평균 유형을 결합한다 (EMA, WMA, SMA, HMA), 흔들림 지표와 EMA 중첩 라인의 위치 관계를 비교하여 시장의 흐름을 판단하고 적절한 시기에 거래한다. 이 전략에는 위험을 제어하고 이익을 잠금하기 위해 중단 및 중지 장치가 포함되어 있습니다.
전략 원칙
전략의 핵심은 매일의 순 거래량 변동치를 계산하여 시장의 정서를 판단하는 것입니다. 구체적인 계산 단계는 다음과 같습니다:
- 가격 범위를 계산하기: 당일 최고 가격, 최저 가격 및 종식 가격에 기초하여 0-1 사이의 곱셈을 계산합니다.
- 거래량을 계산하여 거래량이 상승하거나 감소하는 것을 계산합니다. 거래량이 가격의 변화 방향과 곱하기 두 개에 무게를 더합니다.
- 순 거래량 계산: 유효 상승 거래량을 유효 하락 거래량을 빼고
- 응용 프로그램에서 선택한 이동 평균: 순 거래량 데이터를 부드럽게 처리합니다.
- EMA 중첩선을 계산합니다. 추세를 판단하는 기준선입니다.
- 변화율을 계산하기 (ROC): 트렌드 강도의 변화를 판단하기 위해
거래 신호는 다음과 같은 규칙에 따라 생성됩니다.
- 다중 조건: 진동 지표에 EMA 중첩선을 착용
- 공허 조건: 진동 지표 아래 EMA 중첩선을 통과
- %에 기반한 가격 상쇄
- %에 기반한 가격 정지
전략적 이점
- 다차원 분석: 가격, 거래량, 트렌드 변화율의 3차원을 결합한 시장 정보
- 높은 유연성: 다양한 이동 평균 유형을 지원하고 시장 특성에 따라 조정할 수 있습니다.
- 리스크 관리가 완성된: 리스크를 효과적으로 통제할 수 있는 손해 차단 메커니즘을 포함
- 강력한 시각화 효과: 직사각형으로 트렌드 강도의 변화를 보여 주며 시장 상태를 쉽게 이해할 수 있습니다
- 적응성: 변수 설계로 다양한 시장 환경과 거래 품종에 적응할 수 있습니다.
전략적 위험
- 트렌드 리버스 위험: 불안한 시장에서 빈번한 잘못된 신호가 발생할 수 있습니다.
- 뒤떨어진 위험: 이동 평균 자체는 다소 뒤떨어진 성격을 가지고 있으며, 이는 입단 및 출퇴근 시기가 이상적이지 않을 수 있습니다.
- 매개변수 민감도: 매개변수 조합이 다양하면 전략 성능에 큰 차이가 생길 수 있습니다.
- 시장 환경 의존성: 특정 시장 환경 하에서 좋지 않은 성과를 낼 수 있습니다.
- 기술적인 한계: 기술적인 지표에만 의존하고 기본적 요소를 고려하지 않는다.
위험 관리 제안:
- 다른 시장 환경에 따라 변수 최적화를 제안합니다.
- 다른 기술 지표와 결합하여 신호 확인
- 다양한 시장의 변동성에 맞게 적절히 조정된 스톱 스톱 파라미터
전략 최적화 방향
-
신호 확인 메커니즘의 최적화:
- 수량 확인 조건이 추가되었습니다.
- 추세 강도 필터 추가
- 변동성 적응 메커니즘 소개
-
위험 관리 최적화:
- 동적 손절매 메커니즘 구현
- 자금 관리 모듈 추가
- 매장 개설과 매장 감축을 위한 단계적 제도를 도입
-
변수 최적화:
- 적응 변수 조정 메커니즘 개발
- 시장 환경에 기반한 변수 전환
- 매개 변수를 최적화하기 위해 기계 학습 모델을 추가합니다.
요약하다
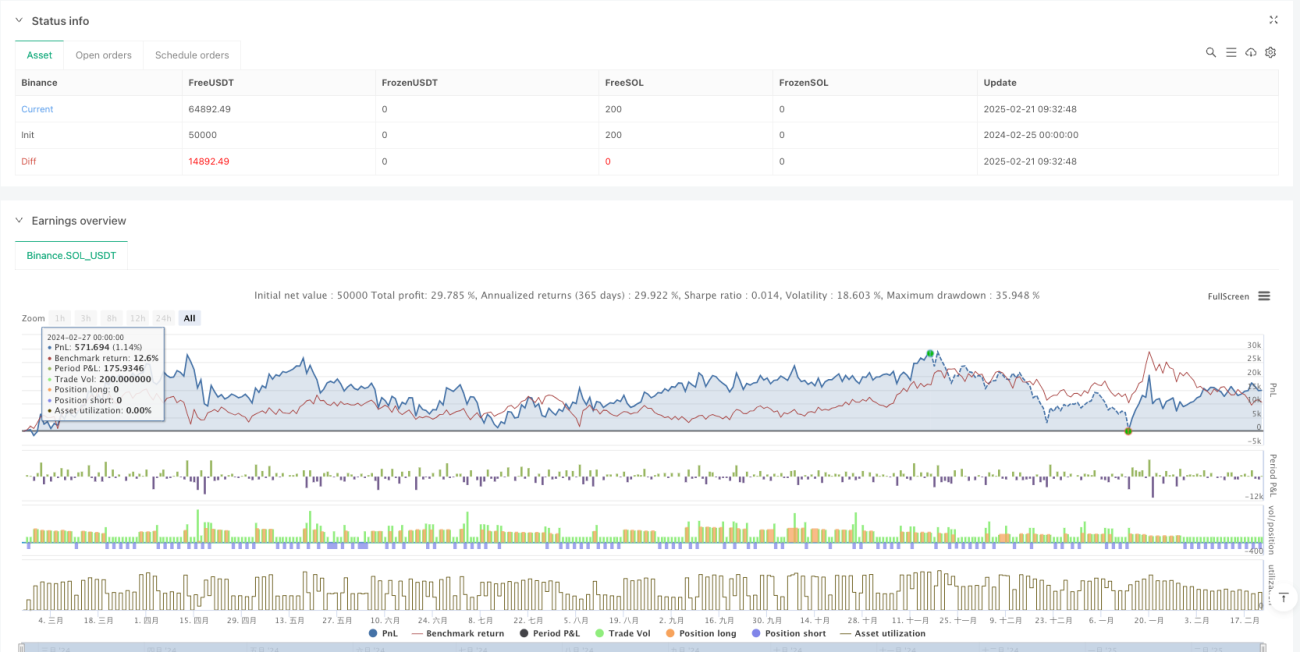
이 전략은 거래량과 가격 데이터를 종합적으로 분석하여 비교적 완전한 트렌드 추적 거래 시스템을 구축한다. 전략의 주요 특징은 여러 가지 기술 지표를 결합하고 유연한 변수 구성 옵션을 제공하는 것이다. 위험이 있음에도 불구하고 합리적인 위험 제어와 지속적인 최적화를 통해 전략은 실제 거래에서 안정적인 수익을 얻을 것으로 예상된다. 거래자는 실장에 사용하기 전에 충분한 피드백을 수행하고 특정 시장 상황에 따라 매개 변수를 적절하게 조정하는 것이 좋습니다.
Source
Pine
/*backtest
start: 2024-02-25 00:00:00
end: 2025-02-22 08:00:00
period: 1d
basePeriod: 1d
exchanges: [{"eid":"Binance","currency":"SOL_USDT"}]
*/

//@version=5
strategy("EMA-Based Net Volume Oscillator with Trend Change", shorttitle="NVO Trend Change", overlay=false, initial_capital=100000, default_qty_type=strategy.percent_of_equity, default_qty_value=100)

// Input parametersStrategy parameters
Related strategies
Comment
All comments (0)
No data
- 1