다중지수 이동평균선 교차 모멘텀 경고 거래 전략

EMA SMA RSI MACD Trend momentum volatility trading strategy
생성 날짜: 2025-03-24 13:49:59 마지막으로 수정됨: 2025-03-24 13:49:59
복사: 0 클릭수: 365
avatar of ianzeng123 ianzeng123
2
집중하다
319
수행원

다중지수 이동평균선 교차 모멘텀 경고 거래 전략 다중지수 이동평균선 교차 모멘텀 경고 거래 전략

개요

이것은 다중 지수 이동 평균 (EMA) 을 기반으로 한 거래 전략이며, 트렌드 추적, 운동 확인 및 변동 경고 시스템을 결합합니다. 이 전략은 주로 5 일, 10 일, 15 일, 20 일, 50 일 및 200 일 EMA 교차 신호를 사용하여 시장 방향을 결정하며, 지능적인 냉각 기간과 위험 경고 메커니즘을 설계하여 거래자가 적절한 시간에 포지션을 열 수 있도록 도와줍니다. 포지션 전략은 거래 기회를 두 가지 상황으로 나누고, 각각 상승 추세와 하향 추세에서 적용되며, 다중 조건 필터링을 통해 거래 시기를 최적화합니다.

전략 원칙

이 전략의 핵심 논리는 다중 EMA 교차와 트렌드 확인에 기반을 두고 있습니다.

  1. 트렌드 판단 메커니즘: 10일 EMA와 20일 EMA의 상대적인 위치와 50일 EMA와 종결 가격의 관계를 통해 시장의 추세를 판단한다. 10일 EMA가 20일 EMA 위에 있고 종결 가격이 50일 EMA보다 높을 때 상승 추세로 판단한다. 반대로 하향 추세이다.

  2. 동력 확인전략은 5일 EMA를 단기 동력 지표로 도입한다. 부자 신호에서는 5일 EMA를 전주기보다 높고 10일 EMA보다 높게 요구한다. 하향 신호에서는 5일 EMA를 전주기보다 낮고 10일 EMA보다 낮게 요구한다.

  3. 지능형 출전규칙:

    • 보수 신호 ((Call): 상승 추세가 확인되고 단기 동력이 상승할 때 포지션을 열고, 가격이 15일 EMA 아래로 떨어질 때 평점 포지션을 다.
    • 하향 신호 ((Put): 하향 추세가 확인되고 단기 동력이 하향으로 갈 때 포지션을 열고, 가격이 15일 EMA를 넘어서면 평형 포지션을 한다.
  4. 냉각기 메커니즘: 전략은 유연한 냉각 기간 설정을 설계하고, 2주기를 기본으로 설정하여, 평점 포지션 후 즉시 포지션을 열 때 발생하는 빈번한 거래를 방지한다. 사용자는 시장 특성에 따라 이 파라미터를 조정할 수 있다.

  5. 위험 경고 시스템A: 5일 EMA와 10일 EMA 사이의 비율의 변화를 계산하여, 최신의 변화율이 이전 5주기의 평균 변화율의 2.5배를 초과하고 현재의 차이는 이전 1주기보다 작을 때, 잠재적인 시장의 비정상적인 변동에 대해 경고 신호를 발동하여, 자동으로 포지션을 청산하여 위험을 회피할 수 있습니다.

전략적 이점

  1. 다단계 추세 확인: 다중 주기 EMA 교차 검증으로, 가짜 브레이크 신호를 줄이고 거래의 신뢰성을 높인다. 전략은 단기 ((5, 10일), 중기 ((15, 20일) 및 장기 ((50, 200일) 이동 평균을 결합하여 시장 추세 상태를 전체적으로 평가한다.

  2. 역동적인 적응력: 전략은 시장의 추세에 따라 거래 방향을 자동으로 전환할 수 있으며, 상승 시장에서 시점 기회를 찾고, 하락 시장에서 시점 기회를 찾고, 시장의 적응성이 좋습니다.

  3. 위험 관리 체계의 개선: 사전 경고 시스템은 시장의 비정상적인 변동을 감지하여 제때 경고를 발송하고 자동으로 평점을 선택하여 철회 위험을 효과적으로 제어할 수 있습니다. 냉각 기간 메커니즘은 과도한 거래를 피하고 거래 비용과 감정 거래의 위험을 줄입니다.

  4. 변수 사용자 정의전략: 전략은 다양한 변수 설정 옵션을 제공하며, 사용자는 다양한 시장 환경과 개인 위험 선호에 따라 EMA 주기, 냉각 기간의 길이는 경고 민감도와 같은 중요한 변수를 조정할 수 있습니다.

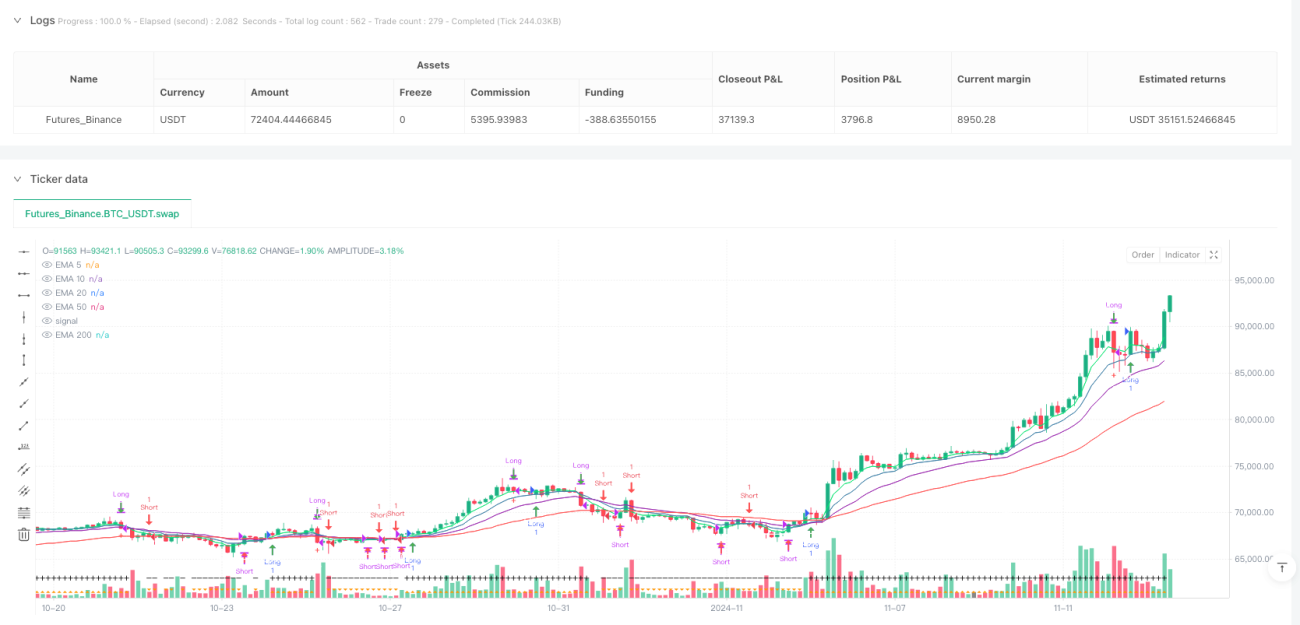
  5. 시각화 거래 신호: 전략은 모양과 색깔을 통해 거래 신호를 명확하게 표시하고, 녹색 화살표는 낙점 신호를 나타내고, 빨간 화살표는 하향 신호를 나타내고, 하단 삼각형은 현재 트렌드 방향을 표시하여 거래 결정을 직관적으로합니다.

전략적 위험

  1. 평균선 뒤떨어짐: 이동 평균은 본질적으로 지연 지표이며, 흔들리는 시장이나 급격한 반전 시장에서 입출장 신호 지연으로 인해 손실이 발생할 수 있습니다. 이 위험을 줄이기 위해 선도 지표가 보조 확인으로 도입되는 것을 고려할 수 있습니다.

  2. 가짜 침입 위험: 전략이 복수의 평균선 교차와 동력 확인을 사용하여 가짜 신호를 줄이기는 하지만, 시장 수평 정리 단계에서는 여전히 평균선 교차로 인한 잘못된 신호가 발생할 수 있습니다. 낮은 변동률 시장 환경에서 신중하게 사용하거나 변수를 조정하는 것이 좋습니다.

  3. 급격한 변동의 위험: 시장의 큰 변동이 있을 때, 경고 시스템은 급격한 가격 변화에 적절하게 대응하지 못할 수 있습니다. ATR (진실 파도) 와 같은 변동률 지표를 추가하고, 동적 스톱로드를 설정하여 추가적인 보호를 제공 할 수 있습니다.

  4. 변수 최적화 함수: 과도한 최적화 매개 변수는 전략이 역사적 데이터에서 우수한 성능을 발휘하지만 미래 시장에서 실패할 수 있습니다. 단계적 최적화 및 샘플 외부 테스트를 통해 매개 변수의 안정성을 검증하는 것이 좋습니다.

  5. 장기적인 변화의 위험: 전략은 장기적인 트렌드 전환의 초기에 연속적인 손실 신호를 생성할 수 있습니다. 200일 EMA와 같은 장기적인 트렌드 지표의 무게를 증가시키거나 트렌드가 불확실할 때 포지션 크기를 줄이는 것을 고려할 수 있습니다.

전략 최적화 방향

  1. 적응 변수 조정: 현재 전략은 고정된 EMA 주기를 사용하며, 시장의 변동성 역학에 따라 EMA 주기의 길이를 조정하는 자기 적응 장치를 도입할 수 있습니다. 예를 들어, 높은 변동성 시장에서 노이즈를 줄이기 위해 더 긴 EMA 주기를 사용하거나, 낮은 변동성 시장에서 민감성을 높이기 위해 더 짧은 EMA 주기를 사용하십시오.

  2. 다중 시간 프레임 분석: 더 높은 시간 프레임의 트렌드 확인을 추가하고, 주 트렌드 방향으로만 거래하면, 승률을 크게 높일 수 있습니다. 예를 들어, 당일 라인과 4 시간 차트가 동시에 상승 추세를 나타낼 때만 포지션을 열어야합니다.

  3. 손해 방지 최적화: 현재 전략의 평점 조건은 간단하다 ((15일 EMA), 동적 중지 손실 메커니즘을 도입할 수 있습니다.

  4. 자금 관리 통합: 리스크 기반의 포지션 규모 조정을 추가하여, 시장의 변동성과 거래 신호 강도에 따라 거래당 자본 비율을 결정하여 전체 리스크 수익률을 최적화합니다.

  5. 감정 지표 보완거래량, 거래량 중화 평균 가격 (VWAP) 또는 시장 폭 지표와 결합하면 트렌드 확인의 신뢰성을 높일 수 있습니다. 특히 중요한 지원 및 저항 지점 근처에서 시장 감정 지표는 추가 확증을 제공 할 수 있습니다.

  6. 기계 학습 최적화기계 학습 기술을 사용하여 신호를 분류하고 필터링하여 높은 승률 거래 환경의 특성을 식별하고 불리한 시장 조건에서 거래를 피하면 전략의 전반적인 성능을 크게 향상시킬 수 있습니다.

요약하다

다중 지수 평행선 교차 운동 경고 거래 전략은 다단계 EMA 교차 신호, 운동 확인, 냉각 기간 메커니즘 및 위험 경고 시스템을 통해 포괄적인 거래 의사 결정 프레임 워크를 만드는 잘 구성된 정량 거래 시스템입니다. 전략은 추세 시장에서 우수한 성능을 발휘하며 비정상적인 시장 변동에 대한 방어 장치가 있습니다.

이 전략의 주요 장점은 다양한 시장 환경에서 안정적인 성능을 유지할 수 있도록 전체적인 추세 판단 장치와 완벽한 위험 제어 시스템입니다. 그러나, 일률에 기반한 거래 시스템으로서, 전략은 여전히 지연 및 가짜 돌파구와 같은 고유한 위험에 직면합니다.

미래 최적화는 변수 적응, 다중 시간 프레임 분석, 동적 손실 및 위험 관리 등에 집중하여 전략의 안정성과 적응력을 더욱 향상시킬 수 있습니다. 기계 학습 기술 및 시장 감정 지표를 도입함으로써 전략의 성능의 질이 뛰어들어 다양한 시장 조건에서 경쟁력을 유지할 수 있습니다.

전략 소스 코드
/*backtest
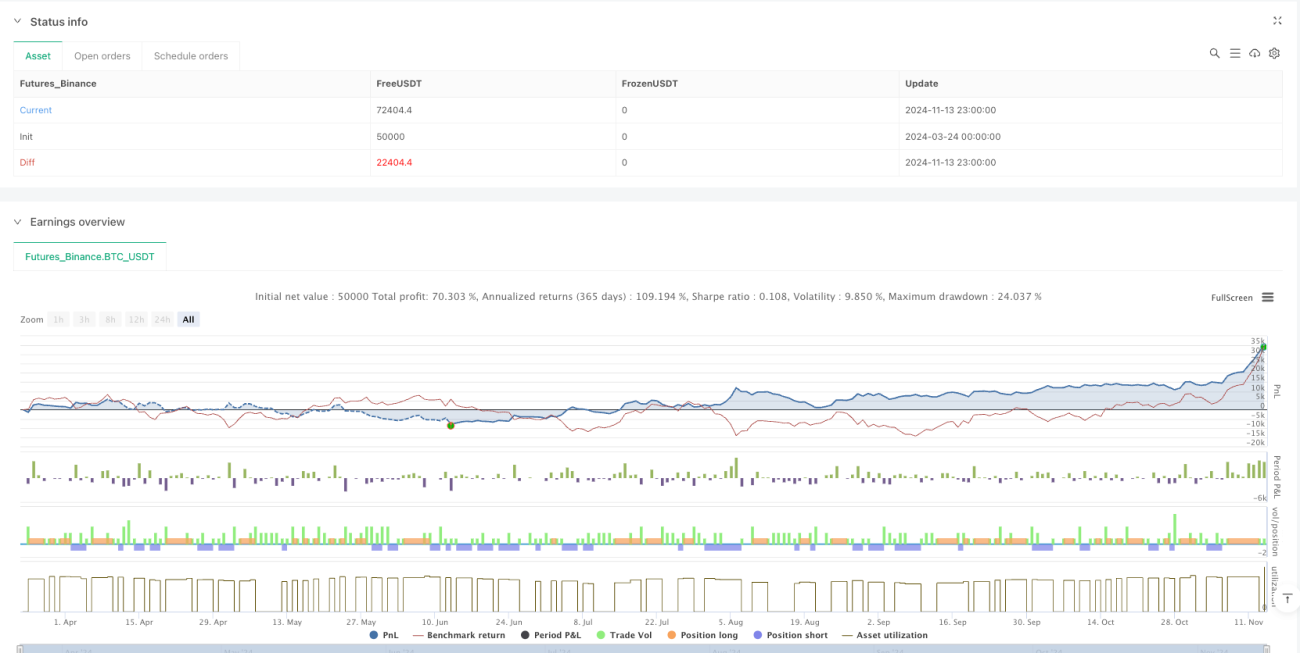
start: 2024-03-24 00:00:00
end: 2024-11-14 00:00:00
period: 3h
basePeriod: 3h
exchanges: [{"eid":"Futures_Binance","currency":"BTC_USDT"}]
*/

//@version=6
strategy(title='GRIM309 CallPut Strategy', shorttitle='CallsPuts Strategy', overlay=true, initial_capital=500, commission_value=0.1)

// Input parameters for EMAs
len5 = input.int(5, minval=1, title='5 EMA Length')
len10 = input.int(10, minval=1, title='10 EMA Length')
len15 = input.int(15, minval=1, title='15 EMA Length')
len20 = input.int(20, minval=1, title='20 EMA Length')
len50 = input.int(50, minval=1, title='50 EMA Length')
len200 = input.int(200, minval=1, title='200 EMA Length')

// EMA calculations
ema5 = ta.ema(close, len5)
ema10 = ta.ema(close, len10)
ema15 = ta.ema(close, len15)
ema20 = ta.ema(close, len20)
ema50 = ta.ema(close, len50)
ema200 = ta.ema(close, len200)

// Plot EMAs with specified colors
plot(ema5, title='EMA 5', color=color.lime)
plot(ema10, title='EMA 10', color=color.rgb(64, 131, 170))
plot(ema20, title='EMA 20', color=color.purple)
plot(ema50, title='EMA 50', color=color.red)
plot(ema200, title='EMA 200', color=color.white)

// Determine trend conditions
uptrend = ema10 > ema20 and close > ema50
downtrend = ema10 < ema20 and close < ema50

// Plot trend indicators at the bottom of the chart
plotshape(series=uptrend, location=location.bottom, color=color.orange, style=shape.triangleup, text='+', title='Uptrend Indicator')
plotshape(series=downtrend, location=location.bottom, color=color.orange, style=shape.triangledown, text='-', title='Downtrend Indicator')

// Position state variable
var int positionState = 0  // 0 = no position, 1 = long, -1 = short

// Cooldown period settings (dont open right after a close)
cooldownBars = input.int(2, minval=1, title='Cooldown Period (bars)')
var int barsSinceClose = na

// Additional check for EMA5 trend confirmation (optional check to see that it is already in momentum short term)
emaCheckCall = ema5 > ema5[1] and ema5 > ema10
emaCheckPut = ema5 < ema5[1] and ema5 < ema10

// Open and close conditions for calls
openCalls = uptrend and emaCheckCall and positionState == 0 and (na(barsSinceClose) or barsSinceClose >= cooldownBars) 
closeCalls = positionState == 1 and (close <= ema15)

// Open and close conditions for puts
openPuts = downtrend and emaCheckPut and positionState == 0 and (na(barsSinceClose) or barsSinceClose >= cooldownBars)
closePuts = positionState == -1 and (close >= ema15)

// --- WARNING SYSTEM ---

// Calculate recent percentage differences between ema5 and ema10
diffNow = (ema5 - ema10) / ema10 * 100
diff1 = (ema5[1] - ema10[1]) / ema10[1] * 100
diff2 = (ema5[2] - ema10[2]) / ema10[2] * 100
diff3 = (ema5[3] - ema10[3]) / ema10[3] * 100
diff4 = (ema5[4] - ema10[4]) / ema10[4] * 100
diff5 = (ema5[5] - ema10[5]) / ema10[5] * 100

if diffNow < 0
    diffNow:=diffNow*-1
if diff1 < 0
    diff1:=diff1*-1
if diff2 < 0
    diff2:=diff2*-1
if diff3 < 0
    diff3:=diff3*-1
if diff4 < 0
    diff4:=diff4*-1
if diff5 < 0
    diff5:=diff5*-1

// Compute average of last 5 changes
avgChange = (math.abs(diff1 - diff2) + math.abs(diff2 - diff3) + math.abs(diff3 - diff4) + math.abs(diff4 - diff5)) / 4

// Check if latest change is more than double the average
isWarning = positionState != 0 and math.abs(diffNow - diff1) > 2.5 * avgChange and diffNow < diff1

// Draw warning symbol
plotshape(series=isWarning, location=location.belowbar, color=color.red, style=shape.cross, text='⚠', textcolor=color.white, title='Warning Signal')

if isWarning //optional, close position if a warning emits
    if positionState == 1  // Only close calls if the last position was a long
        closeCalls := true
    if positionState == -1 // Only close puts if the last position was a short
        closePuts := true

// Update position state and cooldown counter based on signals
if (openCalls)
    strategy.entry('Long', strategy.long)
    positionState := 1
    barsSinceClose := na  // Reset cooldown counter when opening a position

if (closeCalls)
    strategy.close('Long')
    positionState := 0
    barsSinceClose := 0  // Start cooldown counter when closing a position

if (openPuts)
    strategy.entry('Short', strategy.short)
    positionState := -1
    barsSinceClose := na  // Reset cooldown counter when opening a position

if (closePuts)
    strategy.close('Short')
    positionState := 0
    barsSinceClose := 0  // Start cooldown counter when closing a position

// Increment cooldown counter if it's active
if (not na(barsSinceClose))
    barsSinceClose += 1

// Plot open and close signals for Calls
plotshape(series=openCalls, location=location.belowbar, color=color.green, style=shape.arrowup, text='Open', textcolor=color.white, title='Open call position')
plotshape(series=closeCalls, location=location.abovebar, color=color.green, style=shape.arrowdown, text='Close', textcolor=color.white, title='Close call position')

// Plot open and close signals for Puts
plotshape(series=openPuts, location=location.abovebar, color=color.red, style=shape.arrowdown, text='Open', textcolor=color.white, title='Open put position')
plotshape(series=closePuts, location=location.belowbar, color=color.red, style=shape.arrowup, text='Close', textcolor=color.white, title='Close put position')