EMA 이중 교차 동적 손절매 양적 전략

2
Follow
480
Followers
개요
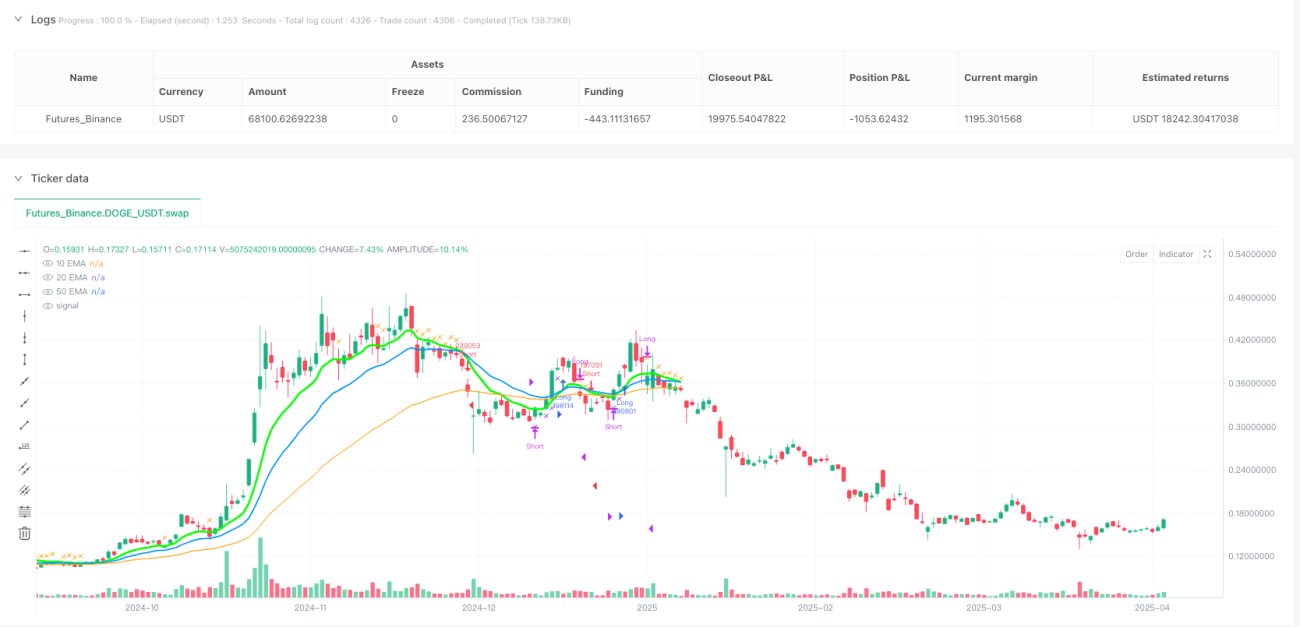
이 전략은 지수 이동 평균 ((EMA) 의 이중 교차 원리에 기초하여 동적 스톱 메커니즘을 결합하여 설계되었습니다. 전략은 10일 EMA와 20일 EMA의 금포크/죽음포크를 주요 거래 신호로 사용하고 50일 EMA를 트렌드 필터로 사용하고 10일 EMA를 동적 스톱 라인으로 사용합니다. 가격이 50일 EMA 상위와 10일 EMA를 통과하면 구매 신호가 발생하고, 가격이 50일 EMA를 넘어 10일 EMA를 통과하면 판매 신호가 발생합니다.
전략 원칙
- 다공격 조건 판단:
- 다면 조건: 10일 EMA가 아래에서 20일 EMA를 통과하고, 현재 종료 가격이 50일 EMA보다 높을 때, 다면 트렌드가 확정된다.
- 허공상 조건: 10일 EMA가 20일 EMA (죽은 포크) 를 상단에서 가로질러, 50일 EMA보다 낮은 현재 종결가격이 있을 때 허공 트렌드가 확정된다.
- 동적 상쇄 메커니즘:
- 다수 포지션 기간 동안, 10일 EMA를 상회하는 경우, 상쇄 포지션을 촉발한다.
- 공백상 지분 기간 동안, 만약 종결 가격이 10일 EMA를 넘으면, 손해배상 지분을 중지한다.
- 트렌드 필터:50일 EMA는 장기적인 트렌드 필터로, 불안정한 상황에서 자주 거래되는 것을 피한다.
우위 분석
- 트렌드 추적 능력: 이중 EMA 교차는 중기 트렌드를 효과적으로 포착하고, 50일 EMA 필터는 가짜 신호를 감소시킨다.
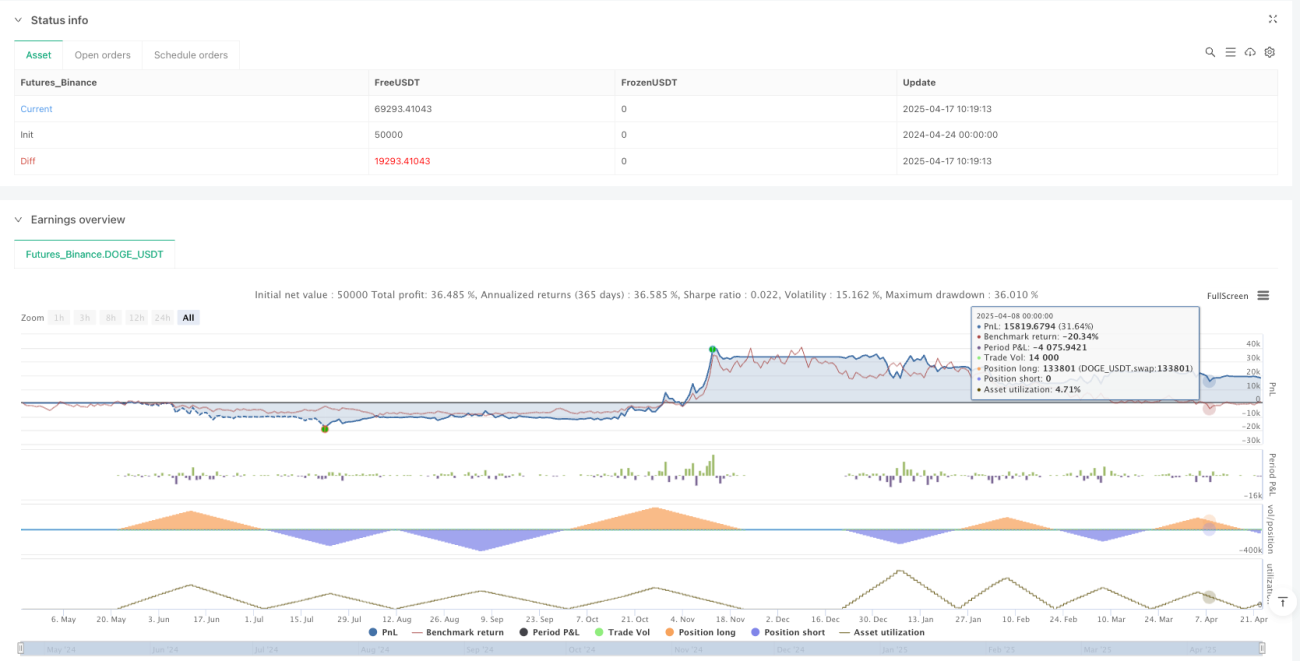
- 동적 위험 관리10일 EMA는 동적 스톱로드 라인으로, 트렌드에 따라 퇴출 지점을 조정하여 이익을 보호한다.
- 시각화 디자인3개의 EMA를 다른 색상과 선폭으로 구분하고, 매매 신호를 표기하여 실시간으로 모니터링할 수 있다.
- 변수 조정 가능: EMA 주기는 입력 파라미터를 통해 유연하게 조정할 수 있으며, 다른 시장 변동률에 적응할 수 있다.
위험 분석
- 지연 위험EMA는 역사적인 자료를 바탕으로 급격한 반전 시에는 더 큰 반전이 발생할 수 있다고 예상했다.
- 해결책: 결합 동력 지표 ((RSI와 같은) 필터 극단적 변동.
- 위기 시장 손실트렌드가 없는 상황에서 교차 신호는 종종 무효 거래의 발동이 될 수 있습니다.
- 해결책: 변동률 지표 (ATR 같은) 를 도입하여 거래를 중단한다.
- 매개 변수가 맞지 않아: 고정 EMA 주기는 모든 시장 상태에 적합하지 않을 수 있습니다.
- 해결책: 적응 주기 알고리즘 또는 다중 시간 프레임 검증을 사용한다.
최적화 방향
- 복합 신호 강화:
- 트랜지스 양 확인이 증가 (예: 돌파할 때 팽창), 신호 신뢰성이 향상 <unk>
- 동적 위치 관리:
- 변동률에 따라 위치 크기를 조정하여 고위험 기간에 노출을 줄인다.
- 기계 학습 최적화:
- 역사 데이터 훈련 모델을 사용하여 EMA 주기 포트폴리오를 동적으로 최적화한다.
- 다중 시간 프레임 검증:
- 주변선 레벨 EMA 방향이 일선 신호와 일치하도록 요구하여 승률을 높인다.
요약하다
이 전략은 EMA 이중 교차와 동적 상쇄를 결합하여 트렌드 추적과 위험 통제의 균형을 이룬다. 핵심 장점은 명확한 논리 구조와 직관적인 시각적 디자인으로 중저 주파수 거래 시나리오에 적합하다. 미래에 더 많은 차원의 시장 데이터를 도입하여 안정성을 더욱 향상시킬 수 있습니다.
Source
Pine
Strategy parameters
Related strategies
Comment
All comments (0)
No data
- 1