
개요
다중 요인 ALMA-ATR 적응형 추세 추종 전략은 여러 기술 지표를 결합하여 진입 및 청산 타이밍을 최적화하는 종합적인 거래 시스템입니다. 이 전략의 핵심은 ALMA(Arnaud Legoux 이동 평균)를 주요 추세 판단 도구로 사용하고, ATR 변동성 필터, RSI 모멘텀 확인, ADX 추세 강도 검증 및 볼린저 밴드 변동성 제어 메커니즘을 통합하는 것입니다. 또한 이 전략은 ATR 기반의 추적 손절 및 신호 시스템인 UT Bot을 통합하여 거래 청산의 정확성을 높입니다.
전략 원리
이 전략의 핵심 원리는 여러 기술 지표의 시너지를 통해 추세가 명확하고 변동성이 적절할 때 거래를 실행하는 것입니다. 구체적으로:
- ALMA를 주요 추세 지표로 사용합니다. ALMA는 기존 EMA 또는 SMA보다 더 부드럽고 지연이 적은 특성을 가지고 있습니다.
- 변동성 필터를 적용합니다. ATR 값이 설정된 최소 임계값보다 높아야 시장에 충분한 변동성이 있음을 보장합니다.
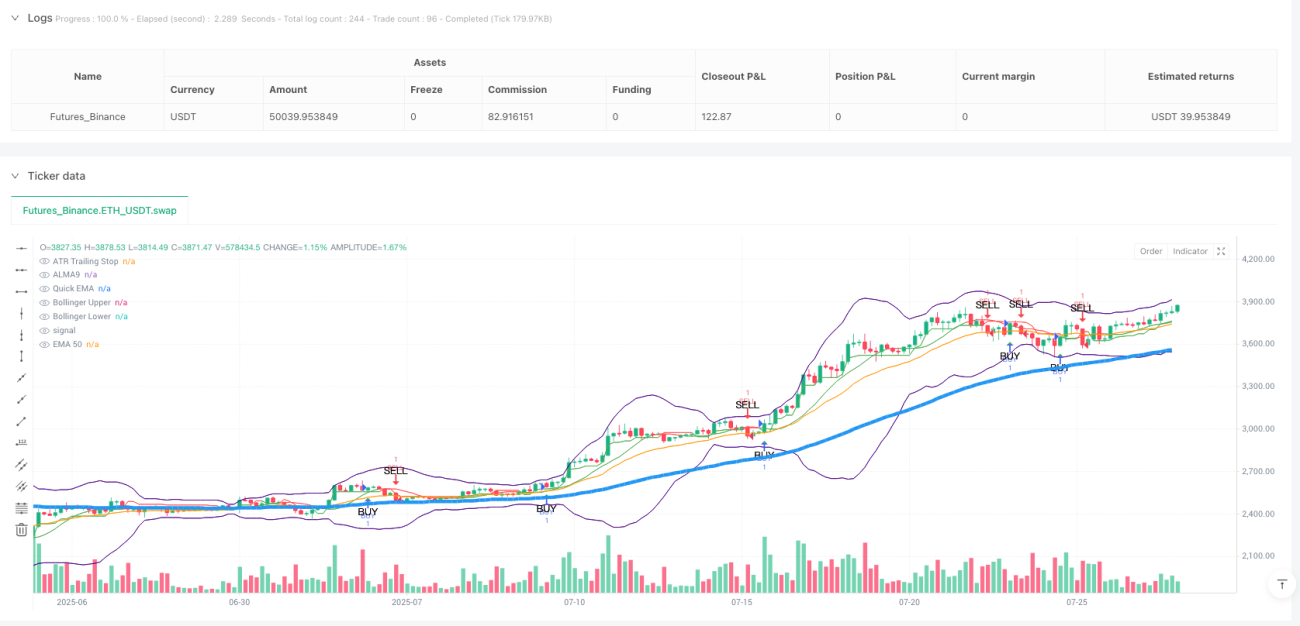
- 진입 조건은 다음과 같습니다. 가격이 EMA50 및 ALMA9 위에 있고, RSI가 과매도 수준보다 높고 30보다 크며, ADX가 30보다 크고(강한 추세를 나타냄), 가격이 볼린저 밴드 상단 아래에 있으며, 냉각 기간 요구 사항을 충족해야 합니다.
- 청산 조건은 다음과 같습니다. 가격이 빠른 EMA를 하향 돌파하거나, ATR 기반 손절/익절이 발생하거나, 시간 기반 청산 조건에 도달합니다.
- ATR 기반 추적 손절선을 사용하는 UT Bot 시스템을 통합하여 거래에 추가적인 보호 메커니즘을 제공합니다.
이 전략은 동적 위험 관리 방식을 사용합니다. 손절 및 익절 수준이 모두 ATR을 기반으로 계산되므로 다양한 시장 조건에서 변동성 변화에 적응할 수 있습니다.
장점 분석
이 전략은 다음과 같은 몇 가지 뚜렷한 장점을 가지고 있습니다.
- 다중 확인 메커니즘: 여러 기술 지표(ALMA, RSI, ADX, 볼린저 밴드 등)를 통합하여 신호의 신뢰성을 높이고 가짜 신호를 줄입니다.
- 적응성 우수: ATR 기반 동적 손절 및 익절 수준은 시장 변동성 변화에 적응할 수 있습니다.
- 효과적인 추세 포착: ALMA의 낮은 지연 특성과 ADX 추세 강도 확인을 통해 추세 변화를 적시에 포착하는 데 도움이 됩니다.
- 리스크 관리 완벽: 변동성 필터, 동적 손절 및 냉각 기간 메커니즘을 통해 다층적인 위험 방어를 제공합니다.
- 시각화 명확: 전략은 차트에 매수 및 매도 신호를 표시하여 트레이더가 시장 상황을 직관적으로 이해할 수 있도록 합니다.
- 유연성 높음: 매개변수 조정을 통해 전략이 다양한 시장 환경 및 거래 주기에 적응할 수 있습니다.
리스크 분석
이 전략은 비교적 완벽하게 설계되었지만, 다음과 같은 잠재적 리스크가 존재합니다.
- 매개변수 최적화 리스크: 매개변수를 과도하게 최적화하면 과거 데이터에서는 우수한 성과를 보일 수 있지만 실제 거래에서는 효과가 없을 수 있습니다.
해결 방법: 순방향 테스트 및 표본 외 데이터 검증을 사용하여 매개변수의 견고성을 보장합니다. - 추세 반전 리스크: 강력한 추세 반전 시 전략이 충분히 빠르게 반응하지 못하여 이익이 줄어들 수 있습니다.
해결 방법: 모멘텀 오실레이터 또는 거래량 분석과 같은 추세 반전 경고 지표를 추가하는 것을 고려합니다. - 과도 거래 리스크: 횡보장에서는 과도한 거래 신호가 발생할 수 있습니다.
해결 방법: 변동성 필터 조건을 강화하거나 횡보장 인식 후 거래를 중단합니다. - 손절 함정 리스크: 시장이 손절을 유발한 후 빠르게 원래 추세로 복귀할 수 있습니다.
해결 방법: 분할 손절 전략을 사용하거나 다양한 시장 조건에 따라 손절 배수를 동적으로 조정하는 것을 고려합니다. - 지연 리스크: ALMA의 지연이 적지만 모든 기술 지표는 본질적으로 어느 정도의 지연이 존재합니다.
해결 방법: 선행 지표를 추가하거나 ALMA 매개변수 설정을 최적화하는 것을 고려합니다.
최적화 방향
전략 분석을 기반으로 다음과 같은 최적화 방향을 제안합니다.
- 시장 상태 분류: 시장 상태 인식 메커니즘을 도입하여 다양한 시장 상태(추세, 횡보, 고변동 등)에서 서로 다른 매개변수 설정을 사용합니다. 이는 다양한 시장 환경에서 전략의 적응성을 향상시킬 수 있습니다.
- 거래량 통합: 거래량 지표를 전략에 포함하여 추세 확인을 위한 보조 도구로 사용하면 신호의 신뢰성을 높일 수 있습니다.
- 다중 시간 프레임 분석: 다중 시간 프레임 확인 메커니즘을 도입하여 거래 방향이 더 높은 시간 프레임의 추세와 일치하도록 합니다.
- 머신러닝 최적화: 머신러닝 알고리즘을 사용하여 매개변수를 동적으로 조정하거나 최적의 진입/청산 지점을 예측합니다.
- 익절 전략 개선: 분할 익절 또는 시장 구조 기반 동적 익절을 구현하여 자금 활용 효율성을 높입니다.
- 신호 품질 점수: 신호 품질 점수 시스템을 개발하여 신호 강도가 특정 임계값을 초과할 때만 거래를 실행합니다.
- 최대 손실 제어 최적화: 전체 포지션 제어 메커니즘을 도입하여 손실이 특정 수준을 초과할 때 포지션을 줄이거나 거래를 중단합니다.
이러한 최적화 방향의 목표는 전략의 견고성을 높이고, 손실폭을 줄이며, 다양한 시장 환경에서 일관된 성과를 유지하는 것입니다.
요약
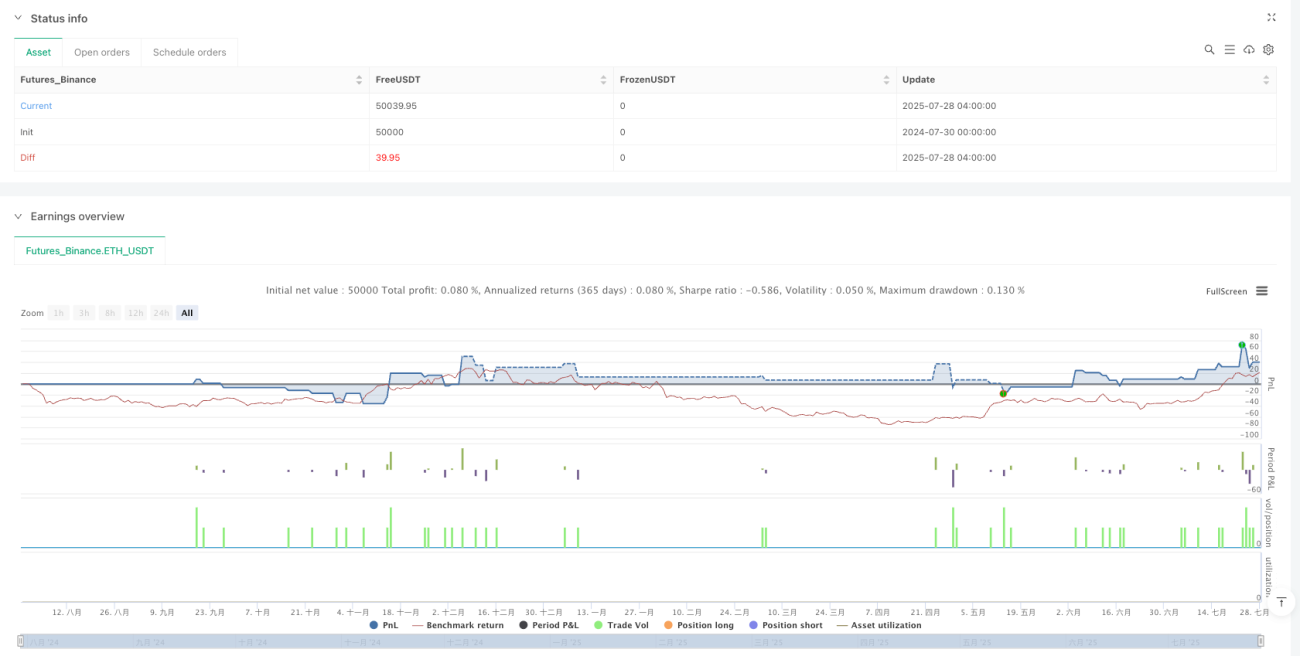
다중 요인 ALMA-ATR 적응형 추세 추종 전략은 종합적이고 위험 관리가 완벽한 거래 시스템입니다. ALMA, ATR, RSI, ADX, 볼린저 밴드 및 UT Bot 등 다양한 기술 도구를 통합함으로써 이 전략은 추세를 효과적으로 식별하고, 노이즈를 필터링하며, 위험을 제어하고, 적절한 시점에 진입 및 청산할 수 있습니다. 이 전략의 핵심 장점은 다중 확인 메커니즘과 적응형 위험 관리 시스템으로, 다양한 시장 환경에서 안정적인 성과를 유지할 수 있게 합니다.
그럼에도 불구하고 모든 거래 전략은 시장 불확실성으로 인한 도전에 직면합니다. 지속적인 매개변수 최적화, 시장 상태 분류 도입, 다중 시간 프레임 분석 통합 등의 방법을 통해 이 전략은 여전히 개선의 여지가 큽니다. 퀀트 트레이더에게 이는 기본 프레임워크가 잘 갖춰진 전략으로, 개인의 위험 선호도와 시장 이해에 따라 추가로 맞춤화하고 최적화할 수 있습니다.
- 1