EMA inFusion Pro 다중 소스 데이터 융합 전략

🎯 전략 핵심 포인트: 단순히 가격만 보는 EMA 전략이 아닙니다
알고 계신가요? 대부분의 사람들은 EMA를 사용할 때 가격만 보지만, 이 전략의 강점은 무엇일까요? 6가지 다양한 데이터 소스에서 EMA를 계산할 수 있습니다! 요리에 소금만 사용하는 것이 아니라 설탕, 식초, 간장도 사용하는 것처럼, 더 풍부한 거래 신호를 제공합니다.
핵심 포인트! 이 6가지 데이터 소스는 다음과 같습니다: 일반 가격, 거래량, 변화율, 평균 캔들 가격, 평균 캔들 거래량, 평균 캔들 변화율. 각각 시장에 대한 다양한 통찰력을 제공합니다!
📊 삼중 필터 시스템: 신호를 더 정밀하게
이 전략은 무작정 신호를 주지 않습니다! 세 가지 "보안 검사"가 있습니다:
첫 번째: EMA 추세 판단 📈
일기예보처럼 먼저 큰 방향이 맑은지 흐린지 확인합니다
두 번째: ADX 강도 필터 💪
ADX는 바람의 세기를 측정하는 기기와 같아서, 추세가 충분히 강할 때만(기본값 25 이상) 신호를 발생시킵니다. 횡보장에서 계속 휘둘리지 않도록 합니다!
세 번째: 거래량 확인 🔊
거래량 급증은 주식이 "크게 말하는" 것과 같아서, 이 신호가 진지하고 장난이 아님을 증명합니다
🎮 세 가지 청산 모드: 다양한 거래 스타일에 맞춤
가장 편리한 점은 이 전략이 게임에 쉬움, 보통, 어려움 난이도가 있는 것처럼 3가지 청산 방식을 제공한다는 것입니다:
모드 1: 반대 신호 청산 🔄
가장 단순하고 강력합니다. 매수 신호가 오면 매도 포지션을 청산하고 매수 진입, 매도 신호가 오면 매수 포지션을 청산하고 매도 진입
모드 2: ATR 동적 손절/익절 📏
시장 변동성에 따라 자동 조정됩니다. 변동성이 클 때는 손절 폭을 넓게, 작을 때는 좁게 설정합니다
모드 3: 고정 비율 손절/익절 📊
가장 이해하기 쉽습니다. 2% 수익 시 청산, 1.5% 손실 시 손절(사용자 정의 가능)
🚀 실전 적용 조언
적합한 시간 프레임: 중단기 거래, 특히 일정한 변동성이 있는 시장에 적합
주의사항: 횡보장에서는 주의가 필요하며, ADX 필터를 켜는 것을 권장합니다
고급 활용: 다양한 데이터 소스를 시도해 볼 수 있으며, 거래량 소스는 돌파 시 거래량 급등에서 특히 효과적입니다!
이 전략의 가장 큰 장점은 유연성입니다. 다양한 시장 환경에 따라 가장 적합한 데이터 소스와 청산 모드를 선택할 수 있습니다. 완벽한 전략은 없고, 현재 시장에 가장 적합한 전략이 있다는 것을 기억하세요!
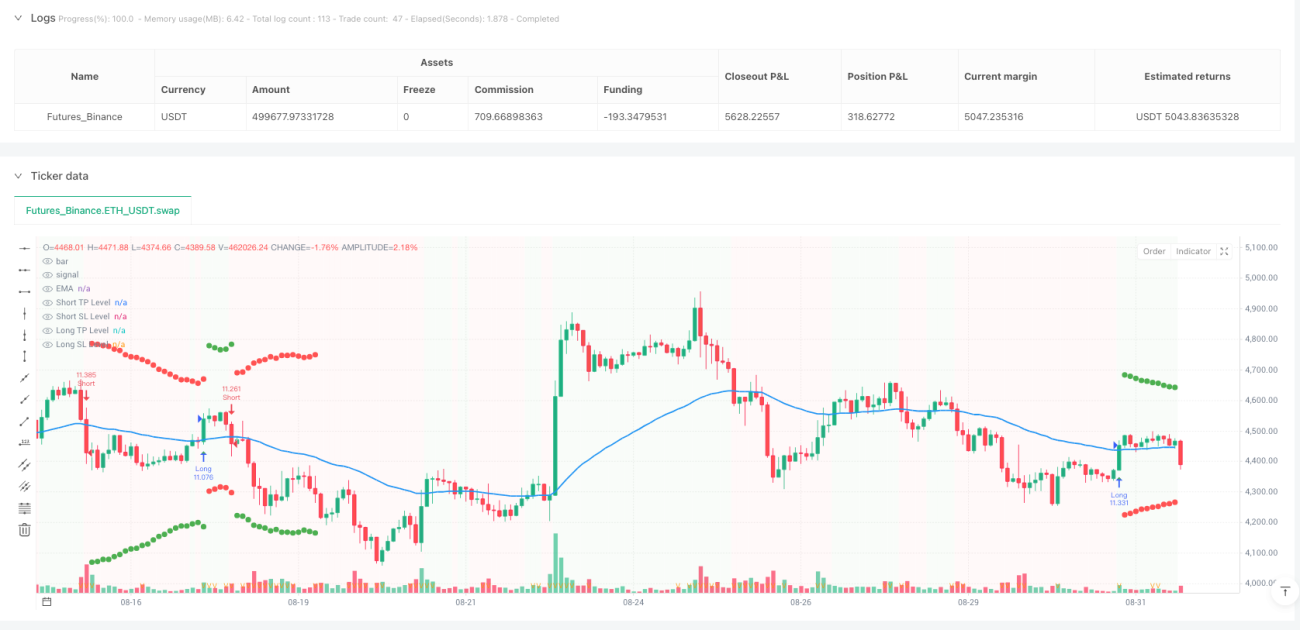
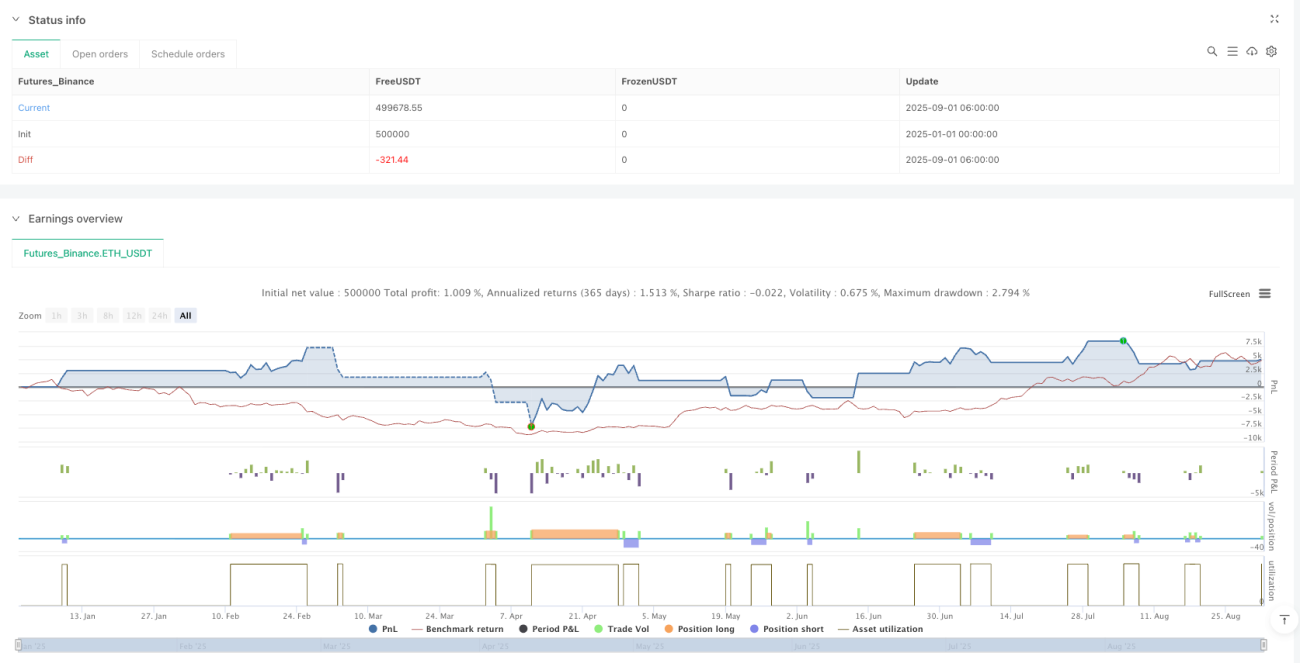
/*backtest
start: 2025-01-01 00:00:00
end: 2025-09-01 08:00:00
period: 2h
basePeriod: 2h
exchanges: [{"eid":"Futures_Binance","currency":"ETH_USDT","balance":500000}]
*/

//@version=5
//@fenyesk
strategy("EMA inFusion Pro - Source Selection", overlay=true, initial_capital=10000, default_qty_type=strategy.percent_of_equity, default_qty_value=10)
- 1