参数乘数策略:多指标融合的市场节拍器

🎯 이게 무슨 신박한 전략이야?
알고 계셨나요? 이 전략은 시장에 '슈퍼 레이더'를 장착한 것과 같습니다! 단순히 한두 가지 지표만 보는 것이 아니라, 9가지의 다양한 기술적 지표를 오케스트라처럼 조합합니다. 각 지표는 하나의 '악기'이며, 이들이 조화로운 '음표'를 연주할 때만 전략이 거래 신호를 발생시킵니다. 마치 9명의 전문가가 동시에 귀에 조언을 속삭이고, 대다수가 동의할 때만 행동하는 것과 같습니다!
📊 핵심 원리 대공개
중요 포인트! 이 전략의 정수는 '매개변수 승수' 개념에 있습니다. RSI, ADX, 모멘텀, 변화율, ATR, 거래량, 가속도, 기울기 등의 지표를 먼저 동일한 척도로 표준화한 후, 이를 곱하여 '종합 힘 값'을 얻습니다. 마치 요리할 때 각 조미료마다 최적의 비율이 있듯이, 이 전략은 시장의 다양한 '조미료'의 완벽한 배합을 찾아줍니다! 종합 힘 값이 이동평균선을 돌파할 때가 진입의 최적 타이밍입니다.
🔧 맞춤 설정 가능한 거래 무기
이 전략의 가장 멋진 점은 무엇일까요? 블록 쌓기처럼 자유롭게 조합할 수 있다는 것입니다! 특정 지표를 사용하고 싶지 않다면? 그냥 끄면 됩니다. 주기 매개변수를 조정하고 싶다면? 마음대로 하세요. 심지어 SMA 트렌드 필터도 있어 역추세 거래의 큰 함정을 피할 수 있도록 도와줍니다. 이것은 마치 '거래 전략 DIY 툴킷'과 같아 다양한 시장 환경에 맞게 설정을 조정할 수 있습니다.
⚡ 실전 적용 가이드
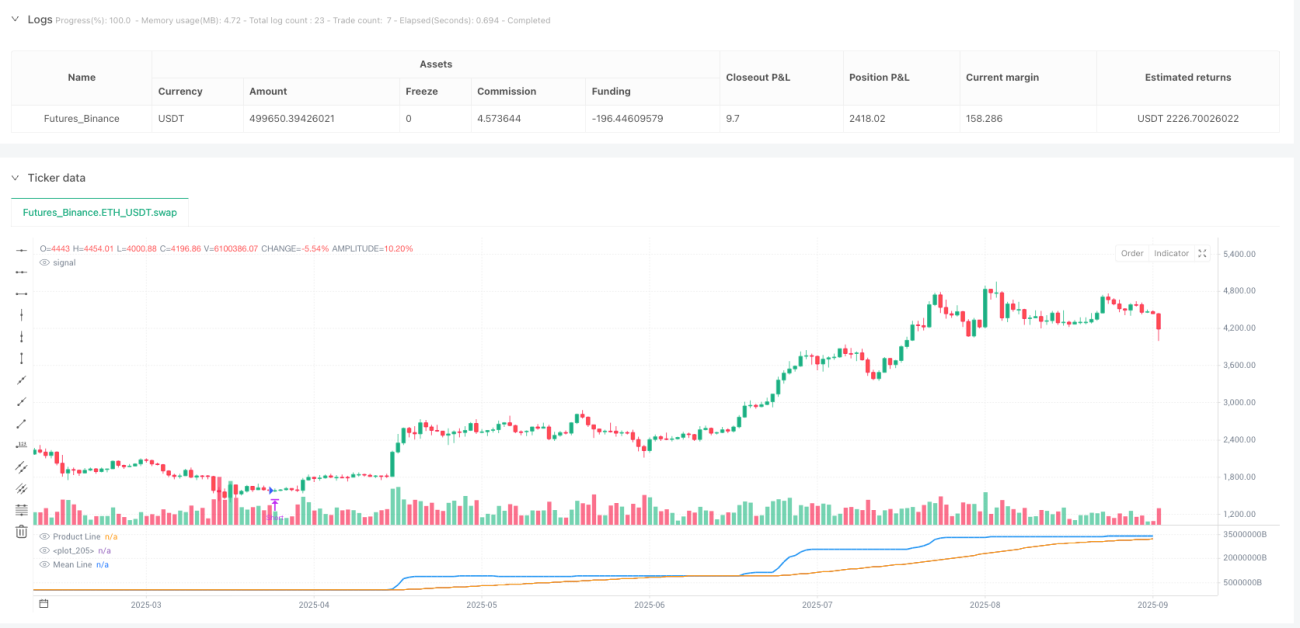
함정을 피하는 가이드입니다! 이 전략은 특히 횡보와 추세가 혼합된 시장 환경에 적합합니다. 파란색 제품선이 주황색 이동평균선을 상향 돌파하면 매수, 하향 돌파하면 매도합니다. 전략에는 자동 청산 메커니즘이 있어 반대 신호가 나타날 때 어리석게 포지션을 유지하지 않도록 합니다. 기억하세요, 트렌드 필터를 켜면 큰 추세에서 능수능란하게 움직일 수 있고, 끄면 더 많은 단기 기회를 포착할 수 있습니다!
//@version=5
strategy("Parametric Multiplier Backtester", shorttitle="PMB", overlay=false)

// Author: Script_Algo
// License: MIT
// Permission is hereby granted, free of charge, to any person obtaining a copy
// of this software and associated documentation files (the "Software"), to deal
// in the Software without restriction, including without limitation the rights
// to use, copy, modify, merge, publish, distribute, sublicense, and/or sell
// copies of the Software, subject to the following conditions:
// The above copyright notice and this permission notice shall be included in
// all copies or substantial portions of the Software.- 1