Strategi Pengganda Parameter: Penjaga Irama Pasaran dengan Penggabungan Pelbagai Penunjuk

🎯 Strategi Hebat Macam Mana Ni?
Tahukah anda? Strategi ini ibarat memasang "radar super" pada pasaran! Ia bukan sekadar melihat satu atau dua penunjuk, tetapi menggabungkan 9 penunjuk teknikal berbeza bagaikan sebuah orkestra. Setiap penunjuk adalah "alat muzik", dan hanya apabila mereka memainkan "nota" yang harmoni, strategi akan mengeluarkan isyarat dagangan. Bayangkan, ini seperti 9 pakar memberi nasihat di telinga anda serentak, dan anda hanya bertindak apabila majoriti mereka bersetuju!
📊 Rahsia Prinsip Teras
Ini penting! Intipati strategi ini terletak pada konsep "pendarab parameter". Ia menstandardkan penunjuk seperti RSI, ADX, Momentum, Kadar Perubahan, ATR, Volume, Pecutan dan Kecerunan ke dalam skala yang sama, kemudian mendarabkannya untuk mendapatkan "nilai kekuatan komposit". Ibarat memasak, setiap perasa mempunyai nisbah optimum, dan strategi ini membantu anda mencari gabungan sempurna pelbagai "perasa" pasaran! Apabila nilai kekuatan komposit melintasi purata bergeraknya, itulah masa terbaik untuk masuk.
🔧 Alat Dagangan Boleh Disesuaikan
Apa yang paling hebat tentang strategi ini? Anda boleh menggabungkannya secara bebas seperti blok binaan! Tidak mahu menggunakan penunjuk tertentu? Matikan sahaja. Nak ubah parameter kitaran? Terpulang pada anda. Malah ada penapis trend SMA untuk membantu anda mengelak daripada perangkap dagangan menentang arah aliran. Ini ibarat "kit alat DIY strategi dagangan" yang membolehkan anda menyesuaikan konfigurasi mengikut keadaan pasaran yang berbeza.
⚡ Panduan Aplikasi Praktikal
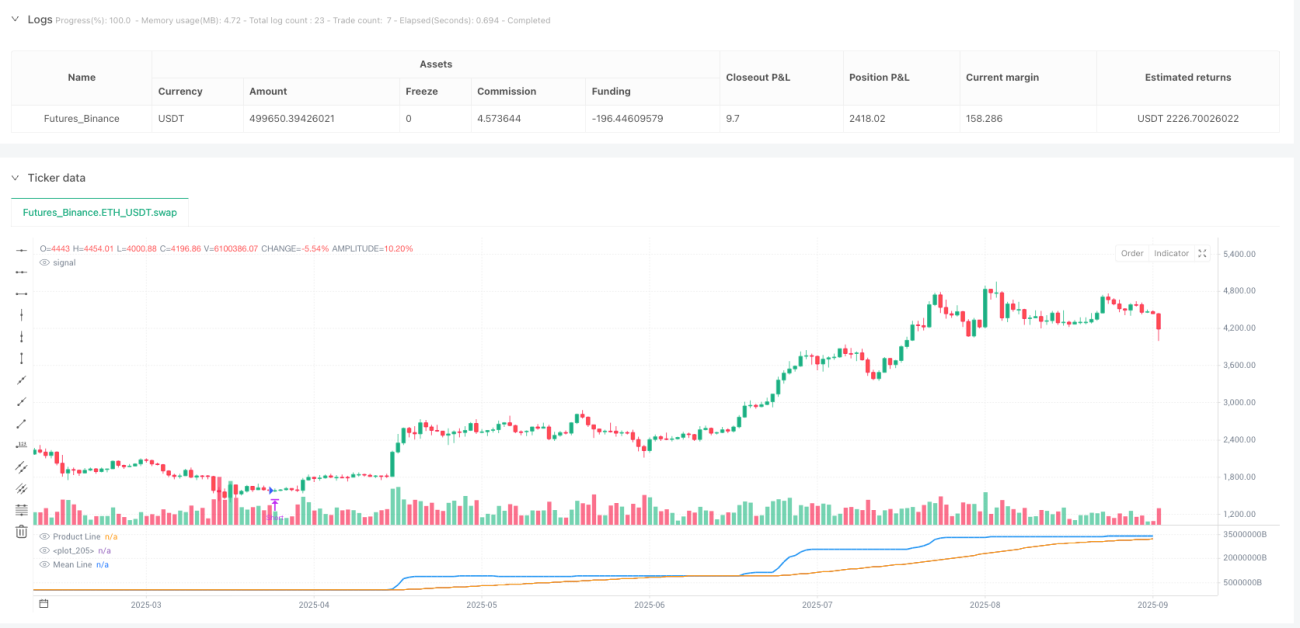
Panduan elak kesilapan tiba! Strategi ini sangat sesuai untuk pasaran bercampur (oscillating dan trending). Apabila garisan produk biru menyeberangi purata bergerak oren ke atas, lakukan beli; apabila menyeberang ke bawah, lakukan jual. Strategi ini juga dilengkapi mekanisme tutup automatik yang berguna, mengelakkan anda daripada terus memegang posisi apabila isyarat bertentangan muncul. Ingat, menghidupkan penapis trend membolehkan anda bergerak lancar dalam aliran besar, manakala mematikannya membolehkan anda menangkap lebih banyak peluang jangka pendek!
//@version=5
strategy("Parametric Multiplier Backtester", shorttitle="PMB", overlay=false)

// Author: Script_Algo
// License: MIT
// Permission is hereby granted, free of charge, to any person obtaining a copy
// of this software and associated documentation files (the "Software"), to deal
// in the Software without restriction, including without limitation the rights
// to use, copy, modify, merge, publish, distribute, sublicense, and/or sell
// copies of the Software, subject to the following conditions:
// The above copyright notice and this permission notice shall be included in
// all copies or substantial portions of the Software.- 1