
1
Follow
47
Followers
O efeito pretendido
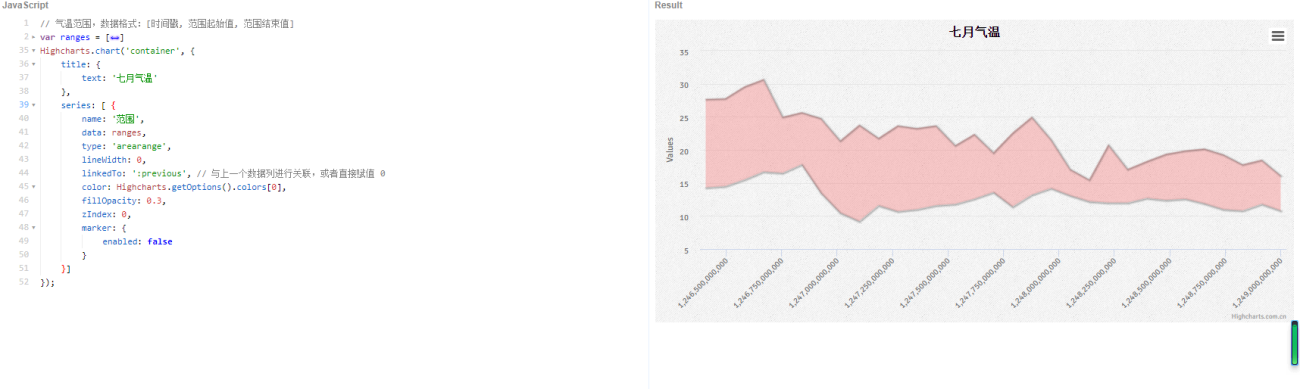
O gráfico que adicionei com o js é o seguinte:
Se a política type='areaerange' for removida, o gráfico de linha K pode ser impresso normalmente, mas se a política posterior for adicionada, o gráfico de linha K não será exibido
Será que a versão HighChart do FMZ não o suporta?
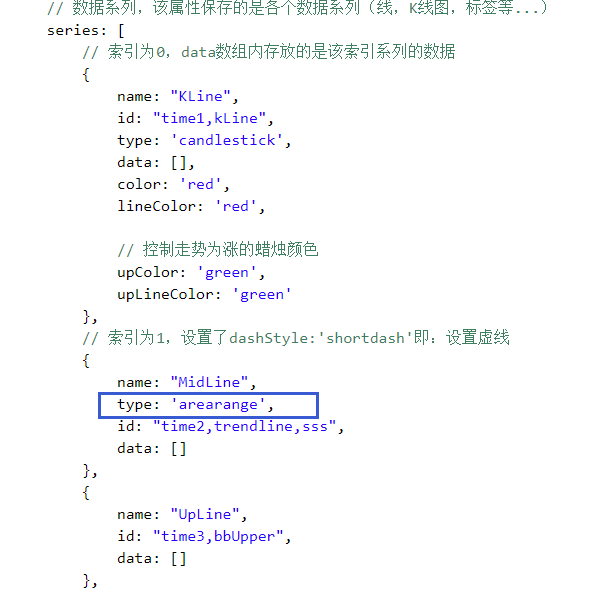
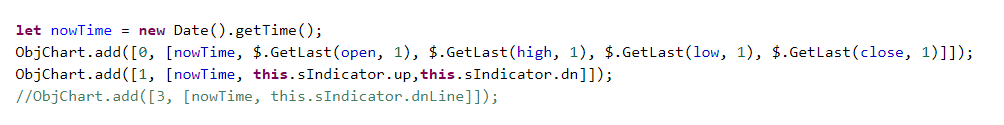
Este é o meu método de adição, add0 e add3 podem ser adicionados, add1 não mostra um espaço em branco, quer seja um comentário ou um ícone de estratégia de comentário
Related Recommendations
How to Specify Different Versions of Data for the Rented Strategy by Its Rental Code MetadataAdvanced Tutorial for FMZ Quant platform Strategy WritingElementary Tutorial for FMZ Quant platform Strategy WritingGet Started with FMZ Quant PlatformSECURITY BUGI keep getting error: Exchange_GetAccount: Invalid ContractTypeWe have an incredibly profitable market making algorithm for sideways markets on Bitmex - but need expert to help eliminate wait times during downward volatility in the marketError with deribitLimitations of the backtesting engineHow to install ta-lib on linux docker?
Comment
All comments (1)
- 1