
No trading quantitativo, o gráfico de velas tradicional é uma das formas de representação de dados mais utilizadas, mas também apresenta certas limitações, como insensibilidade a flutuações ou ruído excessivo. Para observar as tendências de preços com mais clareza, os traders costumam utilizar gráficos aprimorados, como:
- Renko: Sorteios baseados em mudanças de preço e não no tempo, filtrando efetivamente o ruído do mercado.
- Heikin Ashi: Suaviza os dados de preços para mostrar a direção da tendência de forma mais intuitiva.
Este artigo apresentará como calcular gráficos de tijolos e dados médios de K-line com base em K-line comuns na plataforma de negociação quantitativa FMZ, e mostrará o efeito de desenho para ajudar os desenvolvedores de estratégias a analisar tendências de mercado de forma mais intuitiva.
Gráfico de tijolos (Renko)
O gráfico Renko usa "tijolos" como unidades, e um novo tijolo só é desenhado quando o preço flutua além de uma faixa fixa (como US$ 100).
- Vantagens: Com base nas variações de preços, ele filtra pequenas flutuações do mercado e destaca as principais tendências.
- Cenários aplicáveis: Adequado para identificar tendências de médio e longo prazo e reduzir interferências de ruído nas transações.
Interpretação de sinais de negociação
- Confirmação de tendência: tijolos ascendentes contínuos indicam uma tendência forte e você pode manter uma posição; o aparecimento de tijolos invertidos é um sinal de reversão de tendência.
- Negociação de rompimento: quando um novo tijolo aparece, especialmente quando ele quebra a máxima/mínima anterior, considere entrar no mercado.
- Filtragem de falsos rompimentos: como o gráfico de tijolos ignora pequenas flutuações, ele ajuda a filtrar pequenos falsos rompimentos durante o período de oscilação.
Lógica de cálculo central:
- Defina o tamanho do tijolo brickSize
- Com base no preço inicial, compare constantemente se o preço mais recente se desvia do preço do tijolo anterior em mais de brickSize
- Se o preço subir além do limite, um tijolo ascendente é desenhado; o mesmo se aplica ao preço descendente.
Calcule o diagrama de tijolos (Renko) e desenhe o código:
javascript
/*backtest
start: 2025-05-01 00:00:00
end: 2025-06-06 00:00:00
period: 1h
basePeriod: 1m
exchanges: [{"eid":"Binance","currency":"ETH_USDT","balance":1000,"stocks":0.5}]
*/
let globalbricks = []
let lastBarTime = 0
function getBricks(r, brickSize, sourceAttribute, lastPrice) {
for (let i = 1; i < r.length; i++) {
let bar = r[i]
let price = bar[sourceAttribute]
let time = bar.Time
if (time < lastBarTime) {
continue
}
// 遍历原始K线数据
while (Math.abs(price - lastPrice) >= brickSize) {
if (globalbricks.length > 0 && time == globalbricks[globalbricks.length - 1].Time) {
time = globalbricks[globalbricks.length - 1].Time + 1000
}
// 构造砖块
let brick = {
Time: time,
Open: lastPrice,
Close: 0,
High: 0,
Low: 0
}
if (price > lastPrice) {
// 上涨砖块
lastPrice += brickSize
brick.Close = lastPrice
brick.High = lastPrice
brick.Low = brick.Open
} else {
// 下跌砖块
lastPrice -= brickSize
brick.Close = lastPrice
brick.High = brick.Open
brick.Low = lastPrice
}
// 放入数组
globalbricks.push(brick)
// time 累加1秒,防止一根BAR分成多块brick时断开
time += 1000
}
lastBarTime = bar.Time
}
return globalbricks
}
function getRenko(r, brickSize, sourceAttribute) {
// 原始K线数据如果不符合计算要求,直接返回
if (!r || r.length <= 0) {
return null
}
if (globalbricks.length == 0) {
return getBricks(r, brickSize, sourceAttribute, r[0][sourceAttribute])
} else {
return getBricks(r, brickSize, sourceAttribute, globalbricks[globalbricks.length - 1].Close)
}
}
function main() {
let c = KLineChart({
overlay: true
})
while (true) {
let r = _C(exchange.GetRecords)
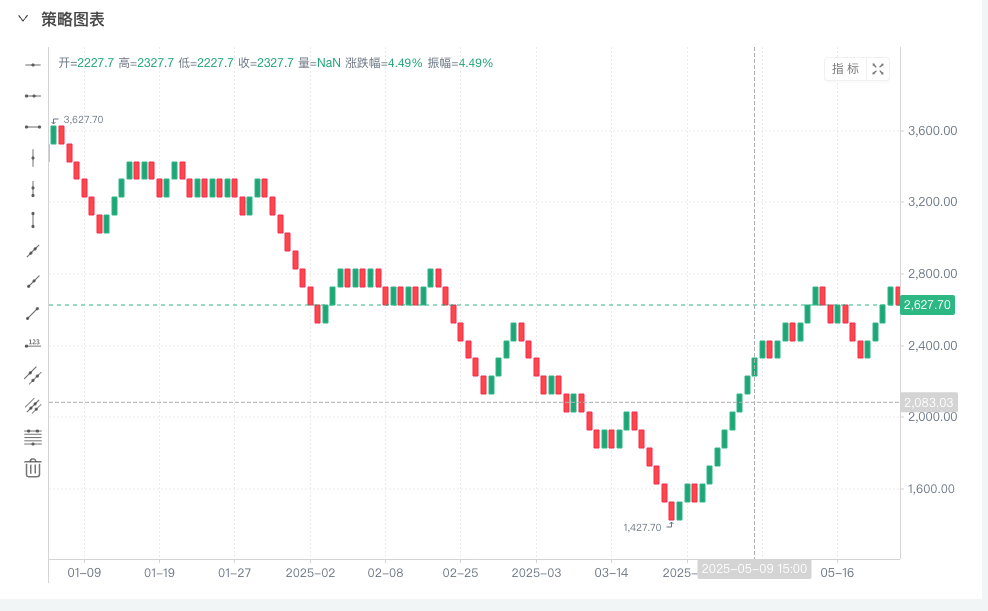
let bricks = getRenko(r, 100, "Close")
bricks.forEach(function (brick, index) {
c.begin(brick)
c.close()
})
Sleep(1000)
}
}
Testes retrospectivos
Heikin Ashi
Heikin Ashi é um processo de alisamento da linha K tradicional
- Vantagens: Fornece uma direção de tendência mais clara e reduz sinais falsos ao suavizar os dados de preços.
- Cenários aplicáveis: Aplicável a estratégias de acompanhamento de tendências, ajudando os traders a manter posições por mais tempo nas tendências.
O método de cálculo é o seguinte:
            HA_Close = (Open + High + Low + Close) / 4
HA_Open = (前一根 HA_Open + 前一根 HA_Close) / 2
HA_High = max(High, HA_Open, HA_Close)
HA_Low = min(Low, HA_Open, HA_Close)
Heikin Ashi 本质上是一种移动平均滤波的 K 线,具有趋势持续性更强的特点。
Julgamento de tendências e reconhecimento de sinais
- Uma vela de alta com um corpo grande e quase nenhuma sombra superior ou inferior indica uma forte tendência de alta
- Uma linha negativa com um corpo grande e quase nenhuma sombra superior ou inferior indica uma forte tendência de queda
- As sombras superior e inferior estão ficando mais longas e o corpo real está encolhendo. A tendência está enfraquecendo, então cuidado com as reversões.
- O corpo é muito curto, a sombra é longa. O mercado está volátil, então não negocie por enquanto.
Código de implementação e desenho:
            javascript

            /*backtest
start: 2025-05-01 00:00:00
end: 2025-06-06 00:00:00
period: 1h
basePeriod: 1h
exchanges: [{"eid":"Binance","currency":"ETH_USDT","balance":1000,"stocks":0.5}]
*/

function toHeikinAshi(records) {
    if (!records || records.length == 0) {
        return null
    }

    let haRecords = []

    for (let i = 0; i < records.length; i++) {
        let r = records[i]
        let ha = {}

        ha.Time = r.Time
        ha.Close = (r.Open + r.High + r.Low + r.Close) / 4

        if (i === 0) {
            // 第一根 Heikin Ashi 的开盘价用普通K线的开盘价和收盘价的均值
            ha.Open = (r.Open + r.Close) / 2
        } else {
            // 后续每根的开盘价 = 上一根Heikin Ashi开盘价和收盘价均值
            ha.Open = (haRecords[i - 1].Open + haRecords[i - 1].Close) / 2
        }

        ha.High = Math.max(r.High, ha.Open, ha.Close)
        ha.Low = Math.min(r.Low, ha.Open, ha.Close)

        haRecords.push(ha)
    }

    return haRecords
}

function main() {
    let c = KLineChart({
        overlay: true
    })

    while (true) {
        let r = _C(exchange.GetRecords)
        let heikinAshiRecords = toHeikinAshi(r)
        heikinAshiRecords.forEach(function (bar, index) {
            c.begin(bar)
            c.close()
        })
        Sleep(1000)
    }
}
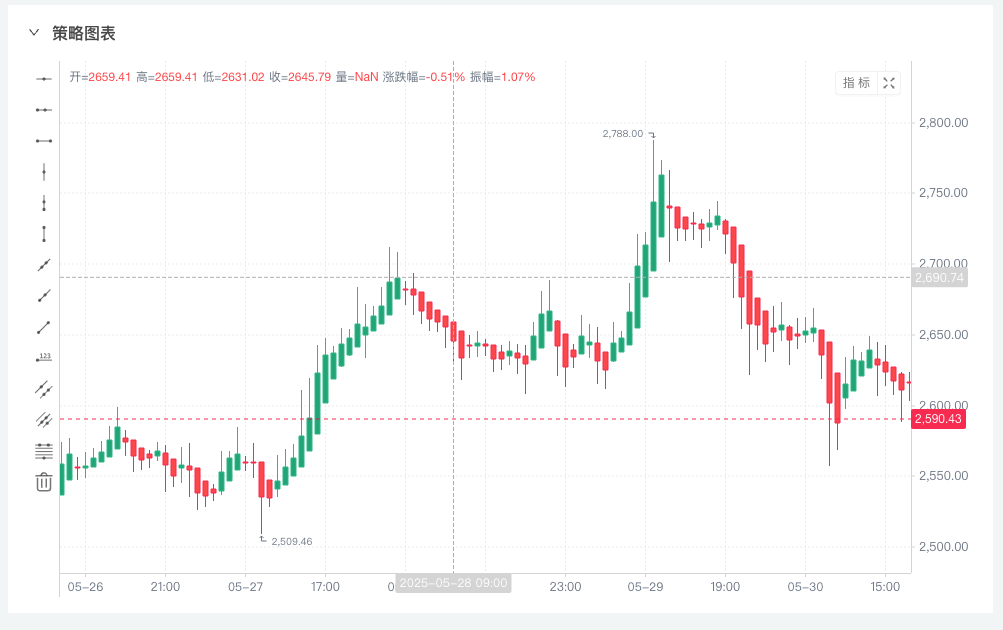
Testes retrospectivos
END
Os gráficos Renko e Heikin Ashi são ferramentas poderosas para traders de tendências:
- O gráfico Renko foca no deslocamento de preços e é adequado para avanços e confirmação de tendências.
- Heikin Ashi foca na suavização de preços e é adequado para controle de posição de tendência.
- O uso complementar dos dois pode melhorar a estabilidade e a capacidade antichoque dos sinais de estratégia de tendência.
É recomendável combinar backtesting e verificação em tempo real, escolher uma solução gráfica que seja adequada aos seus próprios produtos e ciclos de negociação e criar um sistema de negociação quantitativa personalizado.
