Estratégia de previsão de crossover de volatilidade dinâmica MACD

Visão geral
Esta estratégia baseia-se em características de mudança dinâmica do MACD. O núcleo da estratégia é prever os possíveis forks e deadlines, observando as tendências de mudança do gráfico em forma de coluna do MACD.
Princípio da estratégia
A estratégia usa um sistema de indicadores MACD de versão melhorada, contendo o cálculo do diferencial entre a média móvel rápida (EMA12) e a média móvel lenta (EMA26) e uma linha de sinal baseada em 2 ciclos. A lógica de negociação central baseia-se nos seguintes pontos-chave:
- A mudança dinâmica da tendência é avaliada pela taxa de mudança (hist_change) do gráfico em coluna
- Quando o gráfico de coluna é negativo e apresenta uma tendência ascendente em três períodos consecutivos, o prejuízo pode ser um sinal de garfo de ouro, para entrar mais cedo
- Quando o gráfico de colunas é positivo e apresenta uma tendência de queda em três períodos consecutivos, o prontuário pode apresentar um sinal de forquilha morta e sair em posição parada
- A estratégia introduziu um mecanismo de filtragem de tempo, permitindo que as transações sejam feitas apenas em intervalos de tempo especificados
Vantagens estratégicas
- Forte predisposição de sinais: previsão antecipada de possíveis sinais de cruzamento por meio da observação de mudanças dinâmicas no gráfico de colunas, aumentando efetivamente o tempo de entrada
- Controle de risco razoável: taxa de comissão de 0,1% e custo de transação de 3 pontos de deslizamento, compatível com o ambiente de negociação real
- Flexibilidade de gestão de fundos: percentagem do valor total da conta para gestão de posições e controlo de riscos
- Excelente visualização: gráficos em colunas com diferentes cores marcando os altos e baixos e sinais de negociação marcados por setas para facilitar a análise
Risco estratégico
- Risco de Falso Breakout: Falso sinal de breakout pode ser frequente em mercados de baixa volatilidade
- Risco de atraso: apesar do uso de mecanismos de pré-julgamento, o MACD em si é um pouco atrasado
- Dependência do cenário de mercado: estratégias que funcionam melhor em mercados de tendência visível, mas podem não funcionar em mercados de turbulência
- Sensibilidade de parâmetros: configurações de ciclo de linha rápida e lenta têm maior influência no desempenho da estratégia
Direção de otimização da estratégia
- Introdução de filtros de mercado: indicadores de tendência podem ser adicionados, com parâmetros de negociação diferentes em diferentes cenários de mercado
- Optimizar a gestão de posições: proporção de posições pode ser ajustada de acordo com a intensidade do sinal
- Melhorar o mecanismo de stop loss: adicionar stop loss de rastreamento ou stop loss fixo para controlar a retirada
- Mecanismos de confirmação de sinais aumentados: verificação cruzada em combinação com outros indicadores técnicos para aumentar a confiabilidade do sinal
- Seleção de parâmetros de otimização: pode ser adotado um método de parâmetros adaptativos, ajustando os parâmetros do indicador de acordo com a dinâmica da situação do mercado
Resumir
A estratégia, através da utilização inovadora das características de mudança dinâmica do gráfico MACD, permite a melhoria e otimização do sistema de negociação MACD tradicional. O mecanismo de pré-determinação da estratégia pode fornecer sinais de entrada mais cedo, enquanto os rigorosos termos de negociação e as medidas de controle de risco garantem a estabilidade da estratégia.
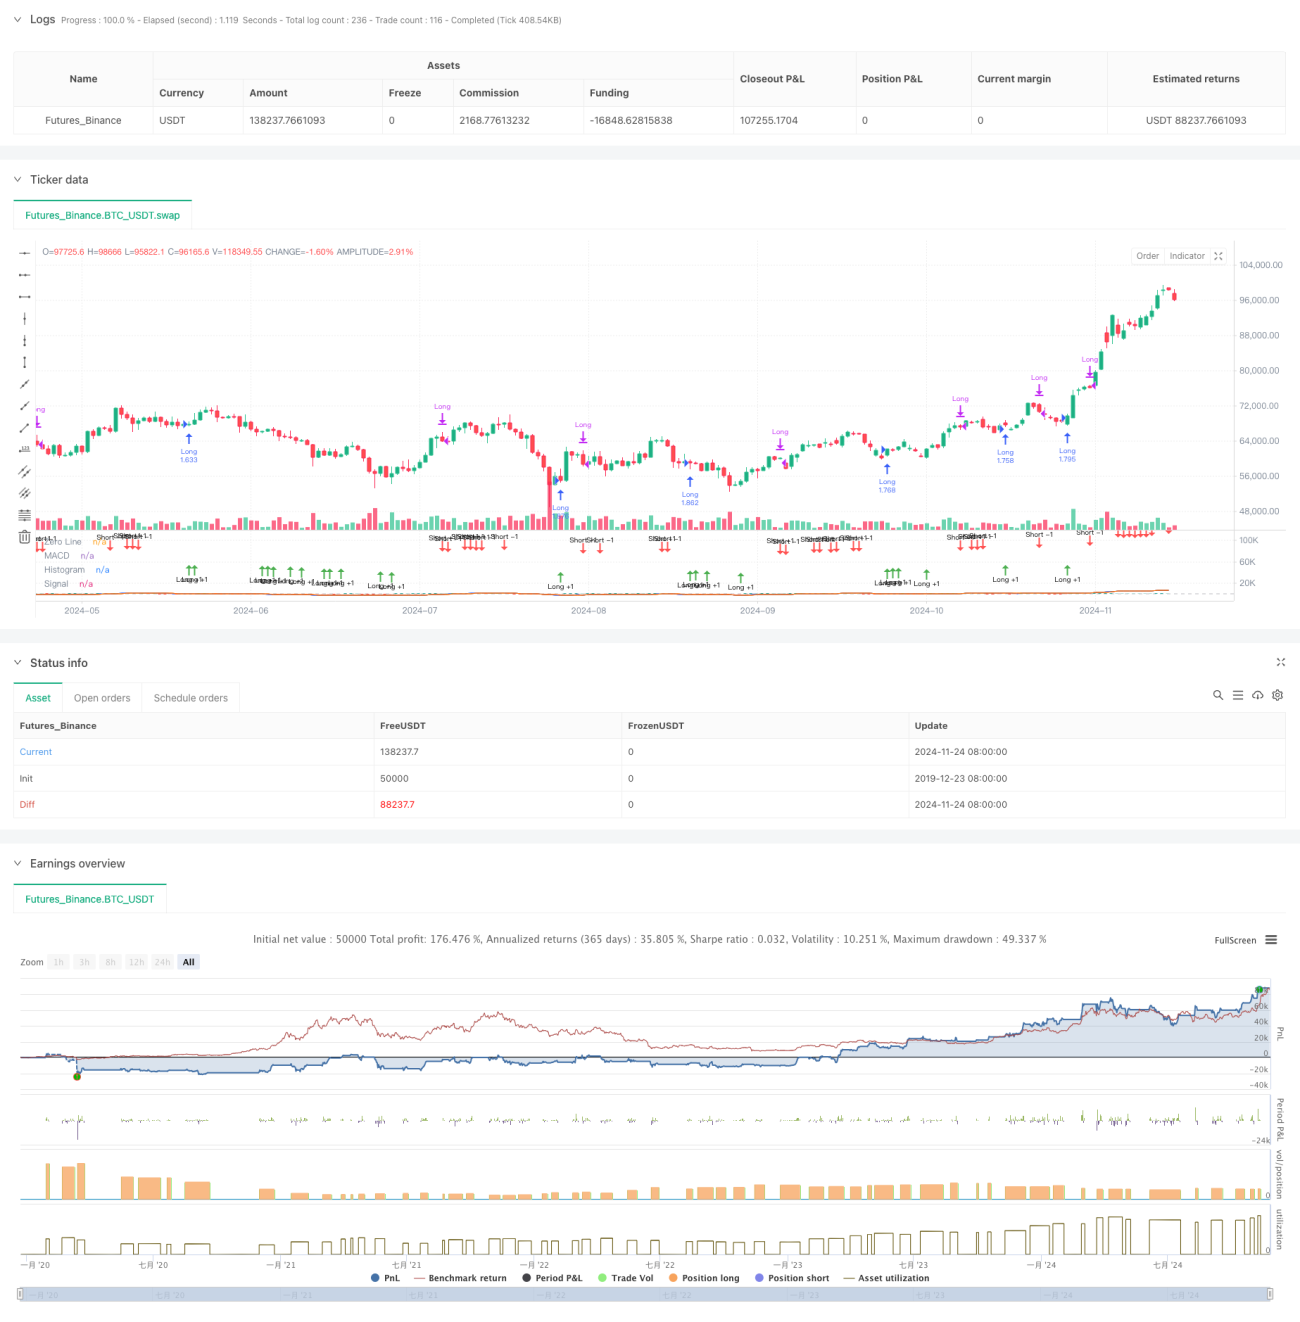
/*backtest
start: 2019-12-23 08:00:00
end: 2024-11-25 08:00:00
period: 1d
basePeriod: 1d
exchanges: [{"eid":"Futures_Binance","currency":"BTC_USDT"}]
*/

//@version=5
strategy(title="Demo GPT - Moving Average Convergence Divergence", shorttitle="MACD", commission_type=strategy.commission.percent, commission_value=0.1, slippage=3, default_qty_type=strategy.percent_of_equity, default_qty_value=100)

// Getting inputs- 1