Acompanhamento de tendências de múltiplos períodos de tempo e estratégia de stop-profit e stop-loss de ATR

ATR EMA
Data de criação: 2024-12-20 14:14:32 última modificação: 2024-12-20 14:14:32
cópia: 0 Cliques: 431
1
focar em
1617
Seguidores

Acompanhamento de tendências de múltiplos períodos de tempo e estratégia de stop-profit e stop-loss de ATR

Visão geral

Trata-se de uma estratégia de negociação de seguimento de tendências que combina o UT Bot e a média móvel do índice de 50 ciclos (EMA). A estratégia negocia principalmente em curto prazo em períodos de 1 minuto, enquanto usa linhas de tendência de períodos de 5 minutos como filtro de direção. A estratégia usa o indicador ATR para calcular dinamicamente a posição de parada e define um duplo objetivo de parada para otimizar os ganhos.

Princípio da estratégia

A lógica central da estratégia é baseada nos seguintes componentes principais:

  1. Utilizando o UT Bot para calcular a resistência de suporte dinâmico
  2. Utilizando o EMA de 50 ciclos de 5 minutos para determinar a direção da tendência geral
  3. Combinação de 21 ciclos EMA e UT Bot sinais para determinar o ponto de entrada específico
  4. Configuração de stop loss de tracking dinâmico por meio do ATR
  5. Estabelecer dois objetivos de paralisação de 0,5% e 1%, equilibrando as posições de 50%

Quando o preço quebra o suporte/resistência calculado pelo UT Bot e o EMA de 21 ciclos cruza com o UT Bot, um sinal de negociação é acionado se o preço estiver na direção correta do EMA de 50 ciclos de 5 minutos.

Vantagens estratégicas

  1. A combinação de múltiplos períodos de tempo aumenta a confiabilidade das transações
  2. O ATR dinâmico pode ser ajustado para se adaptar às flutuações do mercado
  3. A dupla meta de suspensão equilibra lucro e taxa de vitória
  4. O Heikin Ashi pode ser usado como um filtro para filtrar a invasão parcial.
  5. Suporta opções de direção de negociação flexíveis (pode ser apenas a mais, apenas a zero ou de negociação bidirecional)

Risco estratégico

  1. As transações de curto prazo podem ter um alto diferencial e custos com taxas.
  2. Falsos sinais podem ser frequentes em mercados de classificação horizontal
  3. A restrição de múltiplos termos pode fazer com que você perca algumas oportunidades de negociação.
  4. A configuração do parâmetro ATR precisa ser otimizada para diferentes mercados

Direção de otimização da estratégia

  1. Indicadores de volume de transação podem ser adicionados como confirmação auxiliar
  2. Considere introduzir mais indicadores de sentimento de mercado
  3. Desenvolvimento de parâmetros de adaptação para diferentes características de flutuação do mercado
  4. Aumentar a filtragem de períodos de transação
  5. Desenvolver um sistema de gestão de posições mais inteligente

Resumir

A estratégia, através da combinação de múltiplos indicadores técnicos e períodos de tempo, constrói um sistema de negociação completo. Ela contém não apenas condições de entrada e saída claras, mas também fornece um mecanismo de gerenciamento de risco completo. Embora na aplicação prática ainda seja necessário otimizar os parâmetros de acordo com as condições específicas do mercado, a estrutura geral possui boa praticidade e escalabilidade.
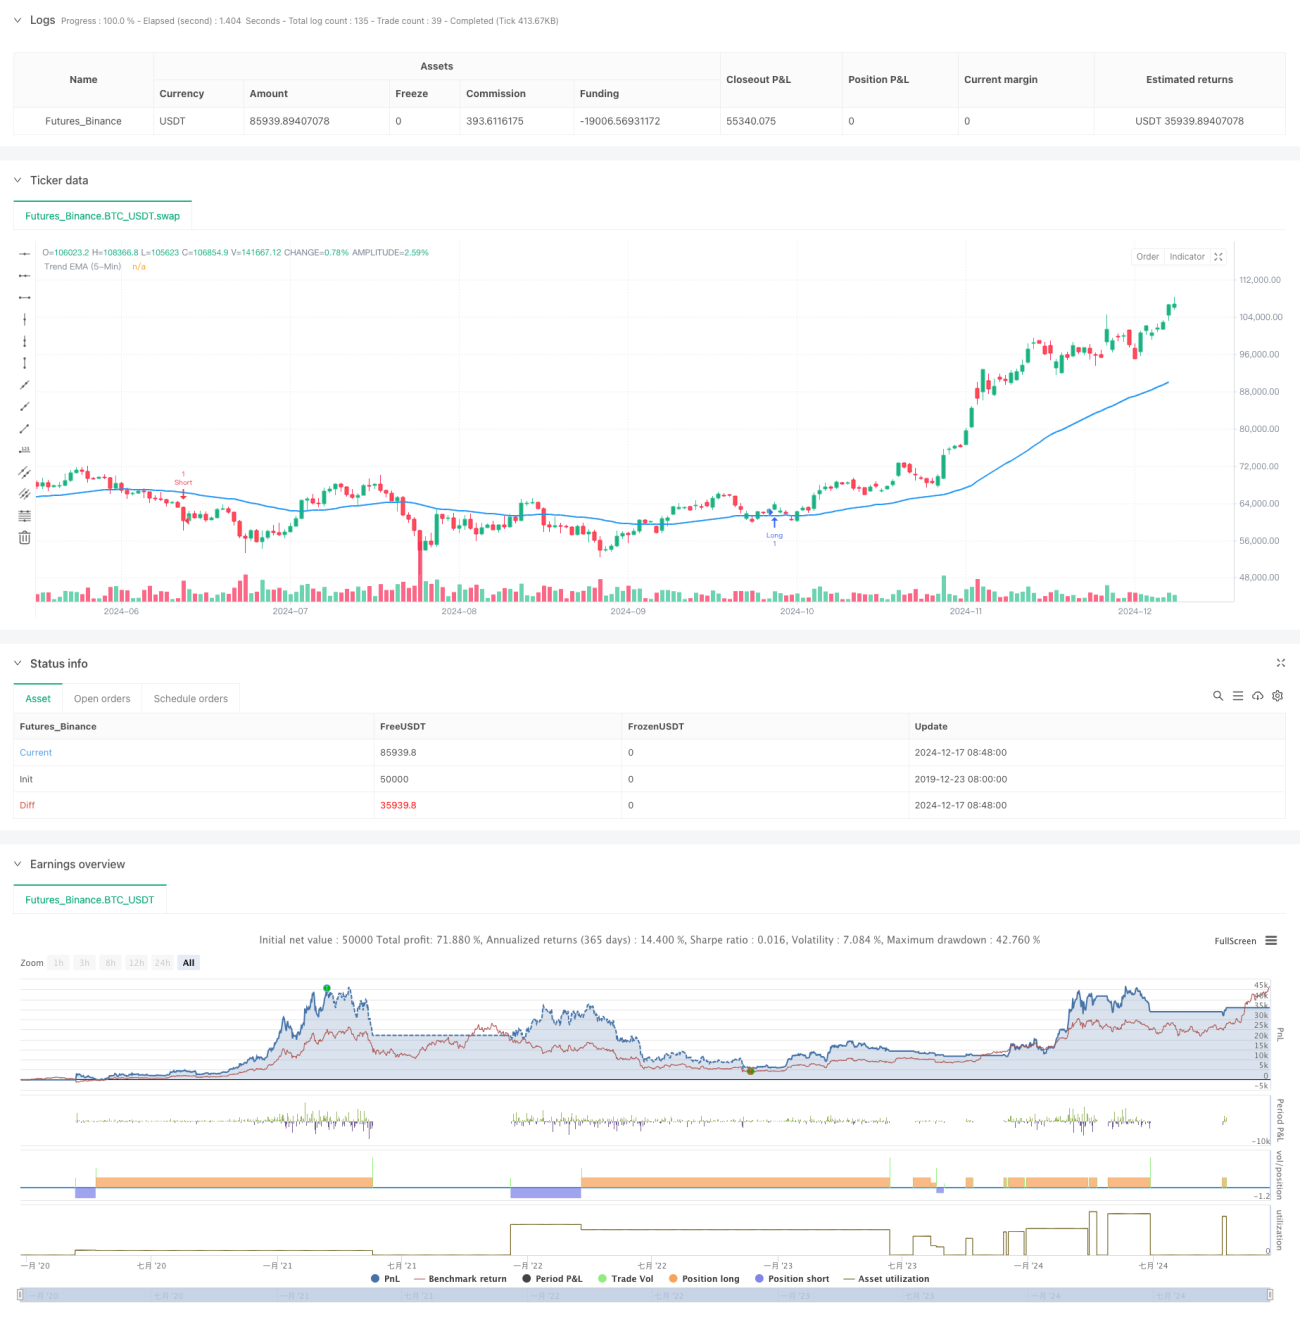
Código-fonte da estratégia
/*backtest
start: 2019-12-23 08:00:00
end: 2024-12-18 08:00:00
period: 1d
basePeriod: 1d
exchanges: [{"eid":"Futures_Binance","currency":"BTC_USDT"}]
*/

//@version=5
//Created by Nasser mahmoodsani' all rights reserved
// E-mail : [email protected]

strategy("UT Bot Strategy with T/P and S/L and Trend EMA", overlay=true)

// Inputs
along = input(1, title='Key Value (Sensitivity - Long)', group="LONG")
clong = input(10, title='ATR Period (Long)', group="LONG")
h = input(true, title='Signals from Heikin Ashi Candles')
ashort = input(7, title='Key Value (Sensitivity - Short)', group="SHORT")
cshort = input(2, title='ATR Period (Short)', group="SHORT")
tradeType = input.string("Both", title="Trade Type", options=["Buy Only", "Sell Only", "Both"])
tp1_percent = input.float(0.5, title="TP1 Percentage", step=0.1, group="TP Settings") // TP1 % input
tp2_percent = input.float(1.0, title="TP2 Percentage", step=0.1, group="TP Settings") // TP2 % input
sl_percent = input.float(1.0, title="Stop Loss Percentage", step=0.1, group="TP Settings") // SL % input
sl_in_percent = input(true, title="Use Stop Loss in Percentage", group="TP Settings")
tp1_qty = input.float(0.5, title="Take Profit 1 Quantity (as % of position size)", minval=0.0, maxval=1.0, step=0.1)
tp2_qty = input.float(0.5, title="Take Profit 2 Quantity (as % of position size)", minval=0.0, maxval=1.0, step=0.1)

// Check that total quantities for TPs do not exceed 100%
if tp1_qty + tp2_qty > 1
    runtime.error("The sum of Take Profit quantities must not exceed 100%.")

// Calculate 50 EMA from 5-Minute Timeframe
trendEmaPeriod = 50
trendEma_5min = request.security(syminfo.tickerid, "5", ta.ema(close, trendEmaPeriod))
plot(trendEma_5min, title="Trend EMA (5-Min)", color=color.blue, linewidth=2)

// Calculations 
xATRlong = ta.atr(clong)
xATRshort = ta.atr(cshort)
nLosslong = along * xATRlong
nLossshort = ashort * xATRshort

src = h ? request.security(ticker.heikinashi(syminfo.tickerid), timeframe.period, close) : close

// LONG
var float xATRTrailingStoplong = na
var float stopLossLong = na
var float takeProfit1 = na
var float takeProfit2 = na

iff_1long = src > nz(xATRTrailingStoplong[1], 0) ? src - nLosslong : src + nLosslong
iff_2long = src < nz(xATRTrailingStoplong[1], 0) and src[1] < nz(xATRTrailingStoplong[1], 0) ? math.min(nz(xATRTrailingStoplong[1]), src + nLosslong) : iff_1long
xATRTrailingStoplong := src > nz(xATRTrailingStoplong[1], 0) and src[1] > nz(xATRTrailingStoplong[1], 0) ? math.max(nz(xATRTrailingStoplong[1]), src - nLosslong) : iff_2long

buy = src > xATRTrailingStoplong and ta.crossover(ta.ema(src, 21), xATRTrailingStoplong) and close > trendEma_5min

if buy and (tradeType == "Buy Only" or tradeType == "Both")
    takeProfit1 := close * (1 + tp1_percent / 100)
    takeProfit2 := close * (1 + tp2_percent / 100)

    // Calculate stop loss based on percentage or ATR
    if sl_in_percent
        stopLossLong := close * (1 - sl_percent / 100)
    else
        stopLossLong := close - nLosslong

    strategy.entry("Long", strategy.long)
    strategy.exit("Take Profit 1", from_entry="Long", limit=takeProfit1, qty=strategy.position_size * tp1_qty)
    strategy.exit("Take Profit 2", from_entry="Long", limit=takeProfit2, qty=strategy.position_size * tp2_qty)
    strategy.exit("Stop Loss", from_entry="Long", stop=stopLossLong, qty=strategy.position_size)

    // // Create Position Projectile for Long
    // var line tpLineLong1 = na
    // var line tpLineLong2 = na
    // var line slLineLong = na
    // var label entryLabelLong = na

    // // Update projectile on entry
    // line.delete(tpLineLong1)
    // line.delete(tpLineLong2)
    // line.delete(slLineLong)
    // label.delete(entryLabelLong)

    // tpLineLong1 := line.new(x1=bar_index, y1=takeProfit1, x2=bar_index + 1, y2=takeProfit1, color=color.green, width=2, style=line.style_solid)
    // tpLineLong2 := line.new(x1=bar_index, y1=takeProfit2, x2=bar_index + 1, y2=takeProfit2, color=color.green, width=2, style=line.style_dashed)
    // slLineLong := line.new(x1=bar_index, y1=stopLossLong, x2=bar_index + 1, y2=stopLossLong, color=color.red, width=2, style=line.style_solid)

// SHORT
var float xATRTrailingStopshort = na
var float stopLossShort = na
var float takeProfit1Short = na
var float takeProfit2Short = na

iff_1short = src > nz(xATRTrailingStopshort[1], 0) ? src - nLossshort : src + nLossshort
iff_2short = src < nz(xATRTrailingStopshort[1], 0) and src[1] < nz(xATRTrailingStopshort[1], 0) ? math.min(nz(xATRTrailingStopshort[1]), src + nLossshort) : iff_1short
xATRTrailingStopshort := src > nz(xATRTrailingStopshort[1], 0) and src[1] > nz(xATRTrailingStopshort[1], 0) ? math.max(nz(xATRTrailingStopshort[1]), src - nLossshort) : iff_2short

sell = src < xATRTrailingStopshort and ta.crossover(xATRTrailingStopshort, ta.ema(src, 21)) and close < trendEma_5min

if sell and (tradeType == "Sell Only" or tradeType == "Both")
    takeProfit1Short := close * (1 - tp1_percent / 100)
    takeProfit2Short := close * (1 - tp2_percent / 100)

    // Calculate stop loss based on percentage or ATR
    if sl_in_percent
        stopLossShort := close * (1 + sl_percent / 100)
    else
        stopLossShort := close + nLossshort

    strategy.entry("Short", strategy.short)
    strategy.exit("Take Profit 1 Short", from_entry="Short", limit=takeProfit1Short, qty=strategy.position_size * tp1_qty)
    strategy.exit("Take Profit 2 Short", from_entry="Short", limit=takeProfit2Short, qty=strategy.position_size * tp2_qty)
    strategy.exit("Stop Loss Short", from_entry="Short", stop=stopLossShort, qty=strategy.position_size)

    // Create Position Projectile for Short
    // var line tpLineShort1 = na
    // var line tpLineShort2 = na
    // var line slLineShort = na
    // var label entryLabelShort = na

    // // Update projectile on entry
    // line.delete(tpLineShort1)
    // line.delete(tpLineShort2)
    // line.delete(slLineShort)
    // label.delete(entryLabelShort)

    // tpLineShort1 := line.new(x1=bar_index, y1=takeProfit1Short, x2=bar_index + 1, y2=takeProfit1Short, color=color.green, width=2, style=line.style_solid)
    // tpLineShort2 := line.new(x1=bar_index, y1=takeProfit2Short, x2=bar_index + 1, y2=takeProfit2Short, color=color.green, width=2, style=line.style_dashed)
    // slLineShort := line.new(x1=bar_index, y1=stopLossShort, x2=bar_index + 1, y2=stopLossShort, color=color.red, width=2, style=line.style_solid)

// Updating Stop Loss after hitting Take Profit 1
if buy and close >= takeProfit1
    strategy.exit("Adjusted Stop Loss", from_entry="Long", stop=close)

// Updating Stop Loss after hitting Take Profit 1 for Short
if sell and close <= takeProfit1Short
    strategy.exit("Adjusted Stop Loss Short", from_entry="Short", stop=close)