
Visão Geral
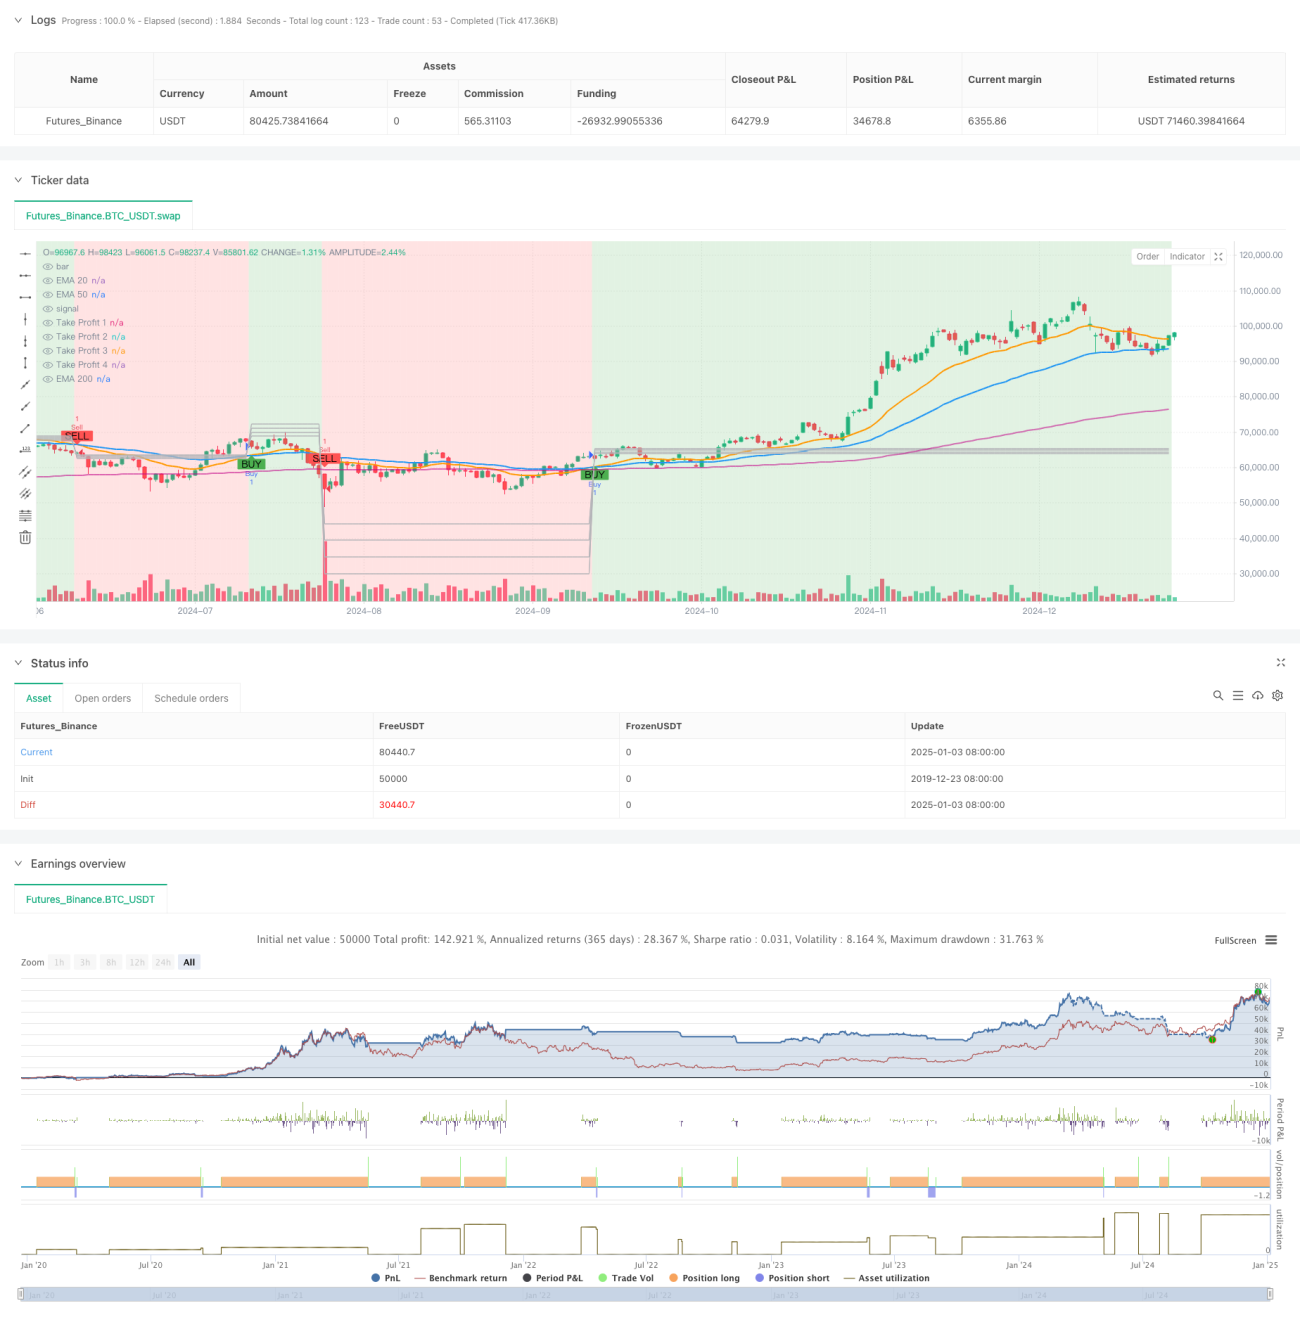
Esta estratégia é um sistema de negociação baseado na Média Móvel Exponencial (EMA), utilizando principalmente os cruzamentos das EMA20 e EMA50 para identificar mudanças na tendência do mercado. A estratégia projeta múltiplos níveis dinâmicos de obtenção de lucros, combinados com um mecanismo de stop loss para controlar o risco. O sistema exibe visualmente a direção da tendência do mercado por meio de alterações na cor de fundo, ajudando os traders a compreender melhor o movimento do mercado.
Princípio da Estratégia
A lógica central da estratégia baseia-se nos seguintes aspectos:
- Utilizar o cruzamento das EMA20 e EMA50 para determinar a direção da tendência: quando a EMA20 cruza acima da EMA50, gera-se um sinal de compra; quando cruza abaixo, gera-se um sinal de venda.
- Definir dinamicamente quatro alvos de lucro com base na faixa de volatilidade da vela anterior:
- TP1 definido como 0,5 vez a faixa de volatilidade
- TP2 definido como 1,0 vez a faixa de volatilidade
- TP3 definido como 1,5 vez a faixa de volatilidade
- TP4 definido como 2,0 vezes a faixa de volatilidade
- Definir um stop loss de 3% para controlar o risco.
- Exibir a direção da tendência por meio de alterações na cor de fundo das velas: tendência de alta mostra verde, tendência de baixa mostra vermelho.
Vantagens da Estratégia
- Definição dinâmica de pontos de lucro: ajusta automaticamente os alvos de lucro de acordo com a volatilidade em tempo real do mercado, com alta adaptabilidade.
- Mecanismo de múltiplos níveis de lucro: ao definir vários pontos de lucro, garante-se a fixação dos ganhos, ao mesmo tempo que se dá espaço suficiente para o desenvolvimento da tendência.
- Visualização proeminente: a direção da tendência é exibida intuitivamente pela cor de fundo, facilitando a rápida avaliação do estado do mercado.
- Controle de risco completo: define um stop loss fixo, controlando efetivamente a perda máxima de cada operação.
- Parâmetros flexíveis e ajustáveis: os traders podem ajustar os multiplicadores dos pontos de lucro e a porcentagem de stop loss de acordo com diferentes condições de mercado.
Riscos da Estratégia
- Atraso das médias móveis: as EMAs possuem inerentemente um atraso, o que pode fazer com que os sinais sejam gerados tardiamente.
- Risco em mercado lateral: em mercados laterais (de consolidação), podem ocorrer frequentes sinais falsos.
- Stop loss fixo: um stop loss de porcentagem fixa pode não ser adequado para todos os ambientes de mercado.
- Intervalo dos pontos de lucro: em mercados com volatilidade intensa, o espaçamento entre os pontos de lucro pode ser muito grande ou muito pequeno.
Direções de Otimização da Estratégia
- Introduzir indicadores auxiliares: podem ser adicionados indicadores como RSI ou MACD como confirmação dos sinais de cruzamento.
- Otimizar o mecanismo de stop loss: considerar o uso de ATR para definir dinamicamente a distância do stop loss.
- Adicionar filtro de tempo: incluir janelas de horário de negociação para evitar períodos de alta volatilidade.
- Melhorar o gerenciamento de posição: ajustar dinamicamente o tamanho da posição de acordo com a volatilidade do mercado.
- Otimizar a confirmação dos sinais: adicionar indicadores como volume como condição auxiliar de confirmação.
Resumo
Esta é uma estratégia de acompanhamento de tendência com estrutura completa e lógica clara. Captura tendências por meio de cruzamentos de médias móveis, gerencia lucros com pontos de lucro dinâmicos e combina stop loss para controlar riscos. O design visual da estratégia é intuitivo e eficaz, e os parâmetros são flexíveis e ajustáveis. Embora haja o problema inerente de atraso das médias móveis, a estabilidade e a lucratividade da estratégia podem ser ainda mais aprimoradas por meio de otimizações e melhorias.
- 1