Visão geral
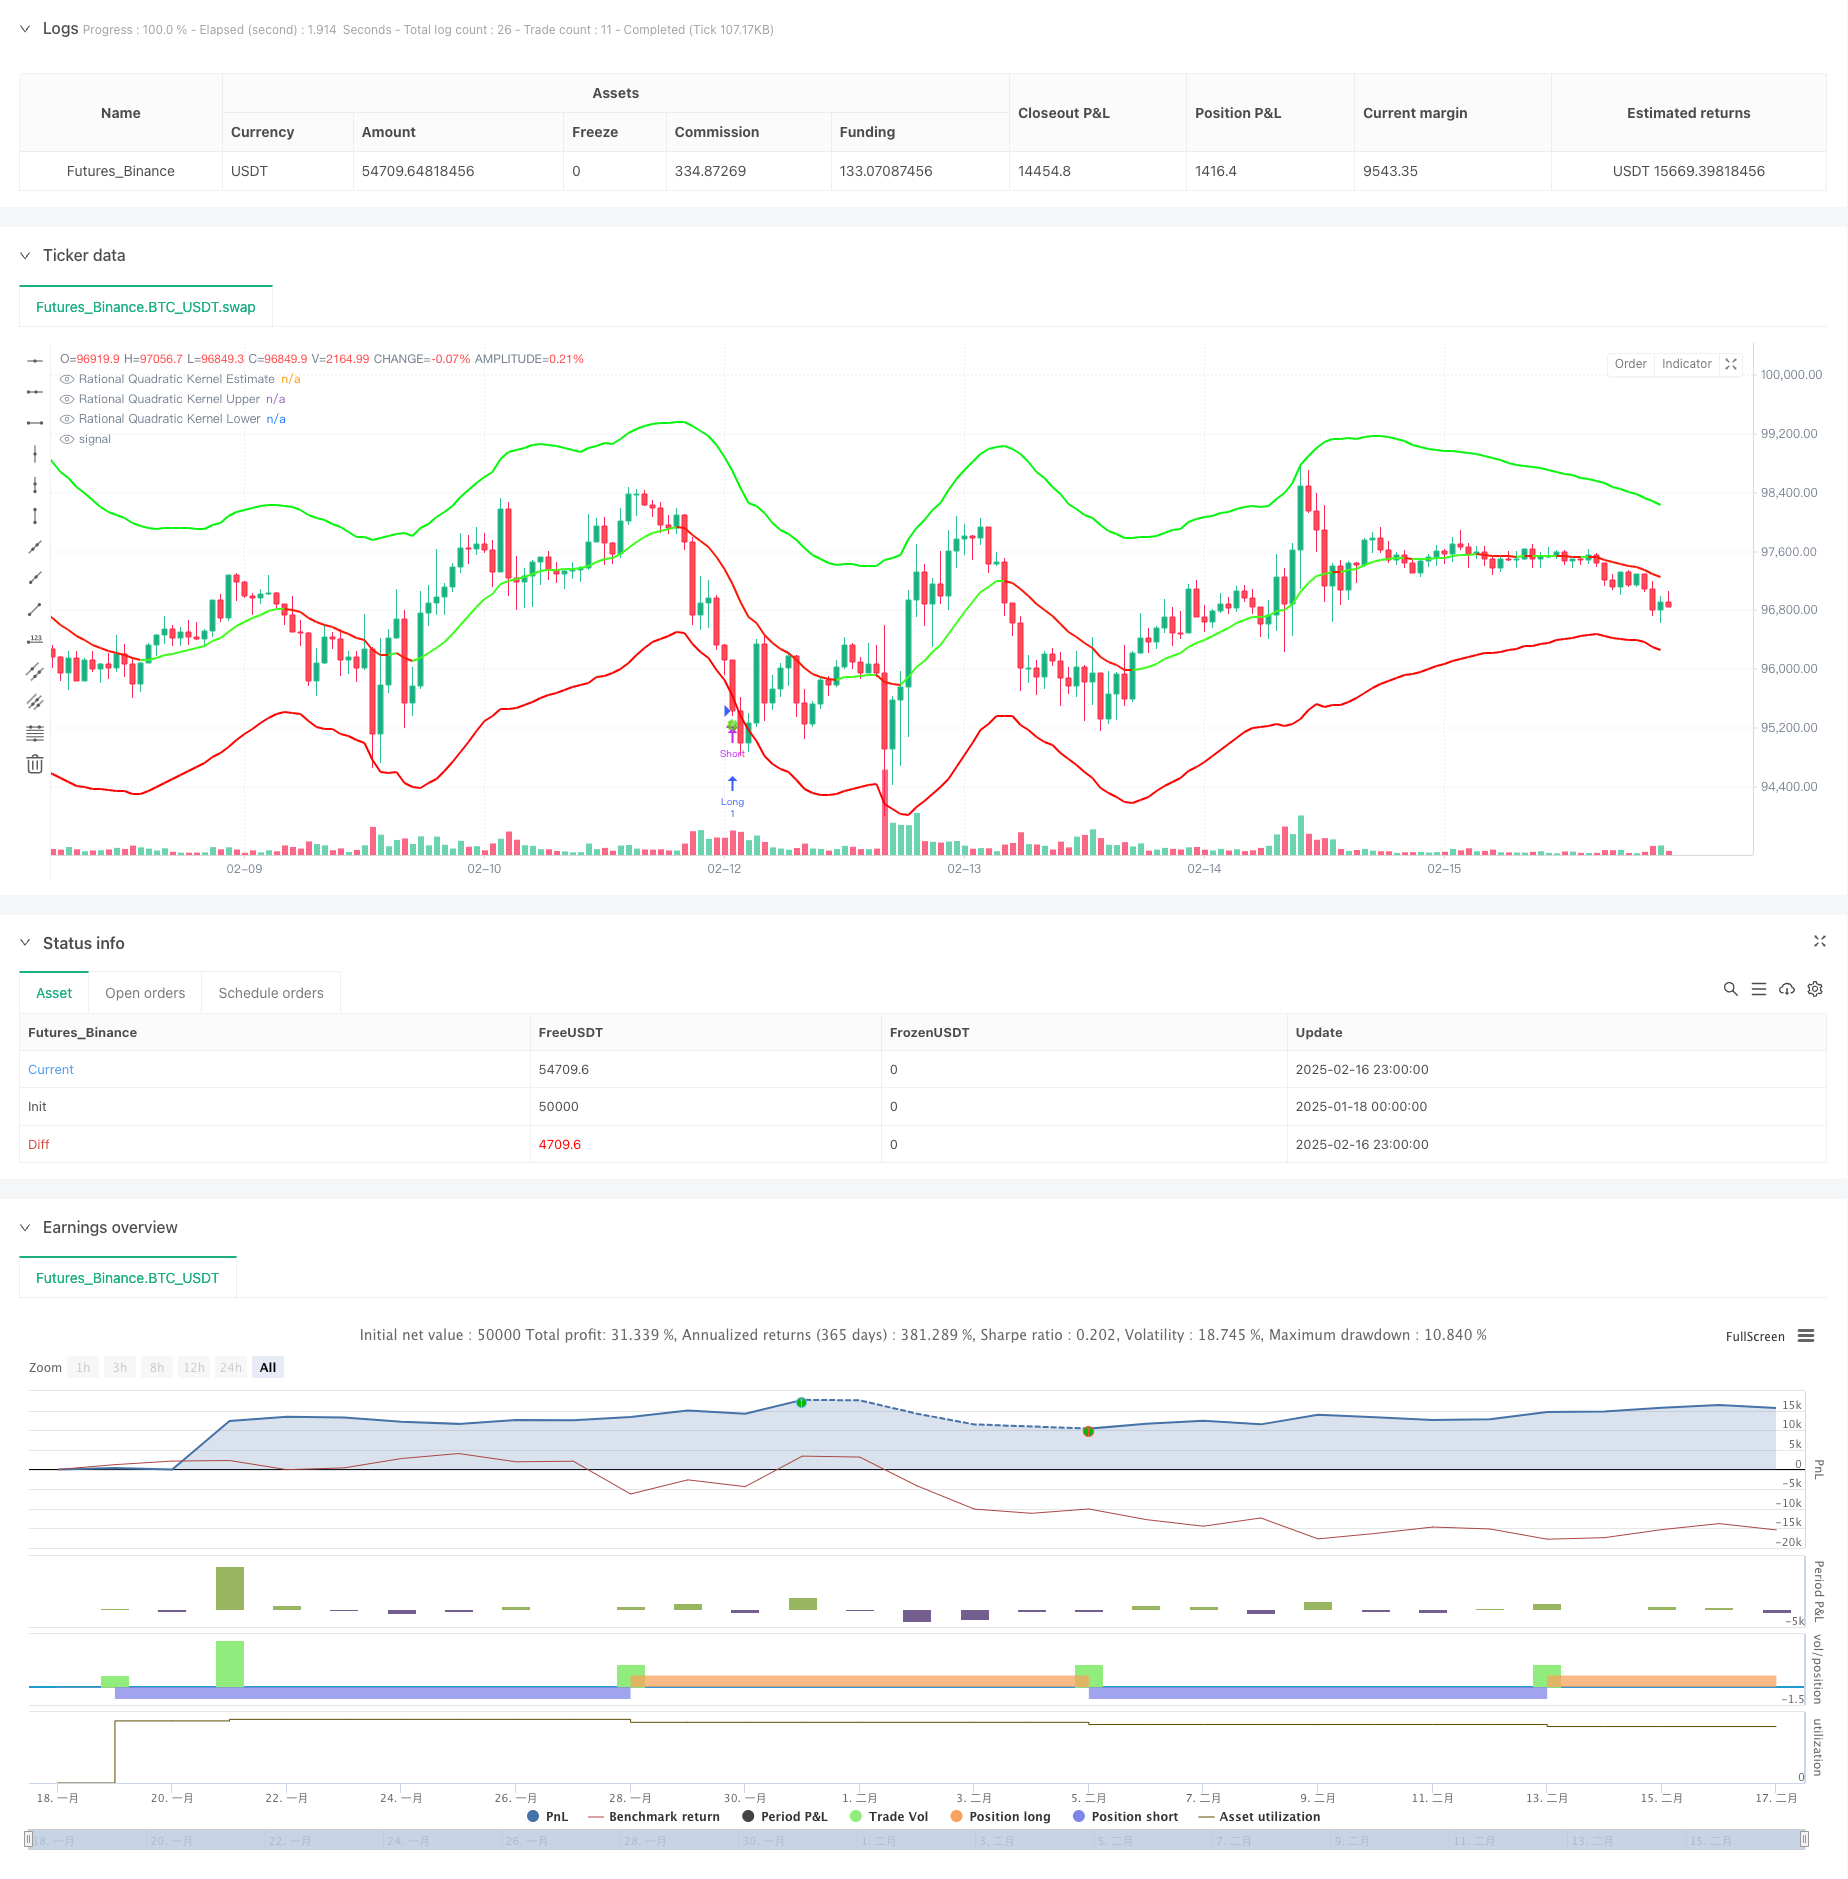
A estratégia é um sistema de rastreamento de tendências adaptativo que combina a regressão nuclear de Nadaraya-Watson e o espectro de ondas dinâmicas do ATR. Ele prevê tendências de preços por meio de funções de núcleo binário lógico e usa suporte e resistência dinâmicos baseados no ATR para identificar oportunidades de negociação. O sistema permite a modelagem precisa do mercado por meio de janelas de regressão configuráveis e parâmetros de peso.
Princípio da estratégia
O núcleo central da estratégia é a regressão de núcleo não paramétrica baseada no método Nadaraya-Watson, que usa funções de núcleo binário lógico para suavizar a sequência de preços. A regressão começa a ser calculada a partir da barra inicial definida e o grau de encaixe é controlado por dois parâmetros-chave, o lookback window (h) e o peso relativo ®. Ao mesmo tempo, em combinação com o indicador ATR, a construção de bandas dinâmicas é feita, com bandas superiores e inferiores regressando respectivamente ao valor estimado de adição e diminuição do ATR. O sistema ativa o sinal de negociação por meio de cruzamentos de bandas com preços - quando o preço quebra as bandas inferiores, faz mais, e quando as bandas superiores fazem menos.
Vantagens estratégicas
- O método de regressão nuclear tem uma boa base matemática para capturar as tendências dos preços de forma eficaz, sem ser excessivamente ajustado.
- A faixa de ondas dinâmica se adapta à volatilidade do mercado, oferecendo pontos de resistência de suporte mais razoáveis
- Parâmetros altamente configuráveis, com flexibilidade de ajuste para diferentes características do mercado
- Mecanismos de identificação de tendências são flexíveis, com opções de modo suave ou sensível
- Os efeitos visuais são intuitivos e os sinais de transação são claros.
Risco estratégico
- A escolha inadequada de parâmetros pode levar a um excesso de ajuste ou atraso
- Os sinais de excesso de negociação podem ser produzidos em mercados em turbulência.
- A configuração imprudente do múltiplo ATR pode causar perda de parada muito ampla ou muito estreita
- Falso sinal pode ocorrer durante a transição de tendência Recomenda-se a otimização dos parâmetros através do histórico de retrospectiva, em combinação com outros indicadores como confirmação auxiliar.
Direção de otimização da estratégia
- Introdução de indicadores de volume de transação como confirmação de tendência
- Desenvolvimento de mecanismos de otimização de parâmetros de adaptação
- Aumentar a intensidade da tendência do filtro reduzir os falsos sinais do mercado de vibração
- Otimização do mecanismo de parada de prejuízos para aumentar a taxa de prejuízos
- Considerar a inclusão de classificações de mercado, com parâmetros diferentes em diferentes mercados
Resumir
A estratégia, combinando métodos de aprendizagem estatística com análise técnica, constrói um sistema de negociação com uma base sólida e prática. Suas características de adaptabilidade e configurabilidade permitem que ele se adapte a diferentes ambientes de mercado, mas precisa prestar atenção à otimização de parâmetros e controle de risco.
/*backtest
start: 2025-01-18 00:00:00
end: 2025-02-17 00:00:00
period: 1h
basePeriod: 1h
exchanges: [{"eid":"Futures_Binance","currency":"BTC_USDT"}]
*/

// This source code is subject to the terms of the Mozilla Public License 2.0 at https://mozilla.org/MPL/2.0/
// © Lupown

//@version=5
strategy("Nadaraya-Watson non repainting Strategy", overlay=true)  // PARAMETER timeframe ODSTRÁNENÝ

//--------------------------------------------------------------------------------
// INPUTS
//--------------------------------------------------------------------------------
src = input.source(close, 'Source')
h   = input.float(8., 'Lookback Window', minval=3., tooltip='The number of bars used for the estimation. This is a sliding value that represents the most recent historical bars. Recommended range: 3-50')
r   = input.float(8., 'Relative Weighting', step=0.25, tooltip='Relative weighting of time frames. As this value approaches zero, the longer time frames will exert more influence on the estimation. As this value approaches infinity, the behavior of the Rational Quadratic Kernel will become identical to the Gaussian kernel. Recommended range: 0.25-25')
x_0 = input.int(25, "Start Regression at Bar", tooltip='Bar index on which to start regression. The first bars of a chart are often highly volatile, and omission of these initial bars often leads to a better overall fit. Recommended range: 5-25')
showMiddle    = input.bool(true, "Show middle band")
smoothColors  = input.bool(false, "Smooth Colors", tooltip="Uses a crossover based mechanism to determine colors. This often results in less color transitions overall.", inline='1', group='Colors')
lag           = input.int(2, "Lag", tooltip="Lag for crossover detection. Lower values result in earlier crossovers. Recommended range: 1-2", inline='1', group='Colors')

lenjeje = input.int(32, "ATR Period",    tooltip="Period to calculate upper and lower band", group='Bands')
coef    = input.float(2.7, "Multiplier", tooltip="Multiplier to calculate upper and lower band", group='Bands')

//--------------------------------------------------------------------------------
// ARRAYS & VARIABLES
//--------------------------------------------------------------------------------
float y1 = 0.0
float y2 = 0.0
srcArray = array.new<float>(0)
array.push(srcArray, src)
size = array.size(srcArray)

//--------------------------------------------------------------------------------
// KERNEL REGRESSION FUNCTIONS
//--------------------------------------------------------------------------------
kernel_regression1(_src, _size, _h) =>
    float _currentWeight = 0.
    float _cumulativeWeight = 0.
    for i = 0 to _size + x_0
        y = _src[i]
        w = math.pow(1 + (math.pow(i, 2) / ((math.pow(_h, 2) * 2 * r))), -r)
        _currentWeight    += y * w
        _cumulativeWeight += w
    [_currentWeight, _cumulativeWeight]

[currentWeight1, cumulativeWeight1] = kernel_regression1(src, size, h)
yhat1 = currentWeight1 / cumulativeWeight1

[currentWeight2, cumulativeWeight2] = kernel_regression1(src, size, h - lag)
yhat2 = currentWeight2 / cumulativeWeight2

//--------------------------------------------------------------------------------
// TREND & COLOR DETECTION
//--------------------------------------------------------------------------------
// Rate-of-change-based
bool wasBearish   = yhat1[2] > yhat1[1]
bool wasBullish   = yhat1[2] < yhat1[1]
bool isBearish    = yhat1[1] > yhat1
bool isBullish    = yhat1[1] < yhat1
bool isBearishChg = isBearish  and wasBullish
bool isBullishChg = isBullish  and wasBearish

// Crossover-based (for "smooth" color changes)
bool isBullishCross  = ta.crossover(yhat2, yhat1)
bool isBearishCross  = ta.crossunder(yhat2, yhat1)
bool isBullishSmooth = yhat2 > yhat1
bool isBearishSmooth = yhat2 < yhat1

color c_bullish    = input.color(#3AFF17, 'Bullish Color', group='Colors')
color c_bearish    = input.color(#FD1707, 'Bearish Color', group='Colors')

color colorByCross = isBullishSmooth ? c_bullish : c_bearish
color colorByRate  = isBullish       ? c_bullish : c_bearish
color plotColor    = smoothColors ? colorByCross : colorByRate

// Middle Estimate
plot(showMiddle ? yhat1 : na, "Rational Quadratic Kernel Estimate", color=plotColor, linewidth=2)

//--------------------------------------------------------------------------------
// UPPER / LOWER BANDS
//--------------------------------------------------------------------------------
upperjeje = yhat1 + coef * ta.atr(lenjeje)
lowerjeje = yhat1 - coef * ta.atr(lenjeje)

plotUpper = plot(upperjeje, "Rational Quadratic Kernel Upper", color=color.rgb(0, 247, 8), linewidth=2)
plotLower = plot(lowerjeje, "Rational Quadratic Kernel Lower", color=color.rgb(255, 0, 0), linewidth=2)

//--------------------------------------------------------------------------------
// SYMBOLS & ALERTS
//--------------------------------------------------------------------------------
plotchar(ta.crossover(close, upperjeje),  char="🥀", location=location.abovebar, size=size.tiny)
plotchar(ta.crossunder(close, lowerjeje), char="🍀", location=location.belowbar, size=size.tiny)

// Alerts for Color Changes (estimator)
alertcondition(smoothColors ? isBearishCross : isBearishChg, title="Bearish Color Change", message="Nadaraya-Watson: {{ticker}} ({{interval}}) turned Bearish ▼")
alertcondition(smoothColors ? isBullishCross : isBullishChg, title="Bullish Color Change", message="Nadaraya-Watson: {{ticker}} ({{interval}}) turned Bullish ▲")

// Alerts when price crosses upper and lower band
alertcondition(ta.crossunder(close, lowerjeje), title="Price close under lower band", message="Nadaraya-Watson: {{ticker}} ({{interval}}) crossed under lower band 🍀")
alertcondition(ta.crossover(close, upperjeje),  title="Price close above upper band", message="Nadaraya-Watson: {{ticker}} ({{interval}}) Crossed above upper band 🥀")

//--------------------------------------------------------------------------------
// STRATEGY LOGIC (EXAMPLE)
//--------------------------------------------------------------------------------
if ta.crossunder(close, lowerjeje)
    // zatvoriť short
    strategy.close("Short")
    // otvoriť long
    strategy.entry("Long", strategy.long)

if ta.crossover(close, upperjeje)
    // zatvoriť long
    strategy.close("Long")
    // otvoriť short
    strategy.entry("Short", strategy.short)