
Visão geral
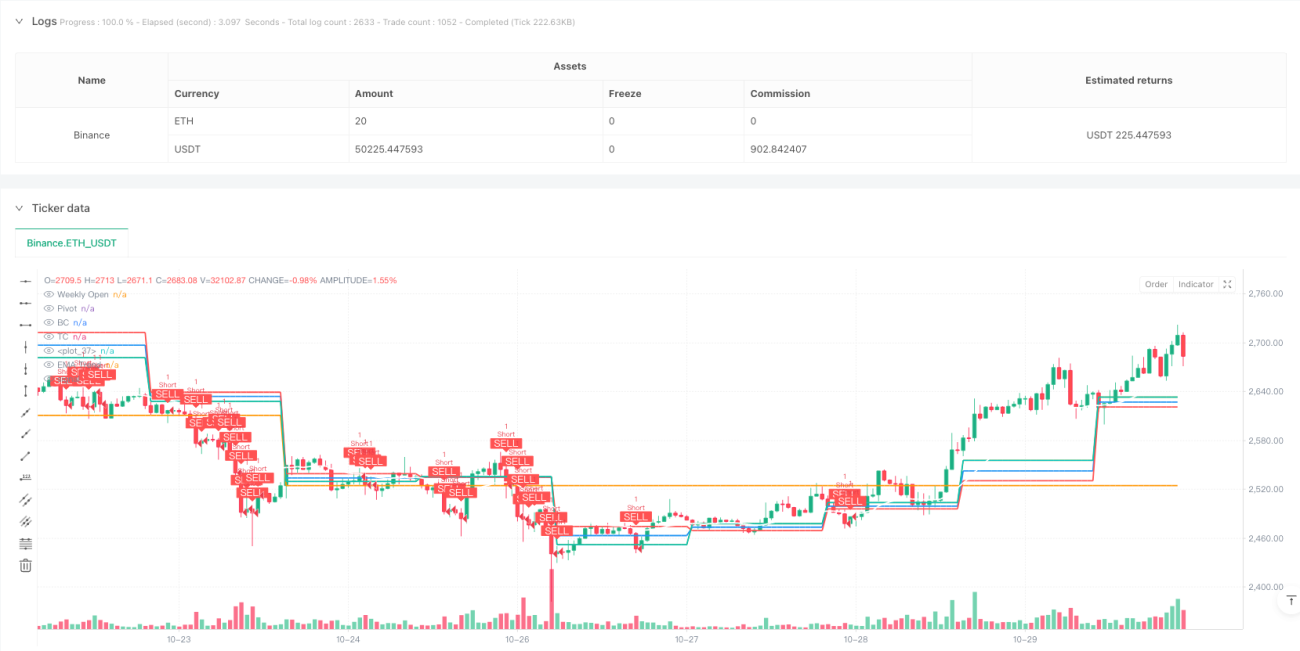
Esta estratégia é um sistema de negociação baseado em análise de múltiplos períodos de tempo, que utiliza principalmente o intervalo de preços centrais (CPR), a média móvel do índice (EMA) e o indicador de força relativa (RSI). A estratégia identifica tendências de mercado e pontos de resistência de suporte crítico através dos níveis de CPR da linha diária, do preço de abertura da semana e do EMA de 20 períodos, e combina a confirmação de volume de transação para executar a negociação.
Princípio da estratégia
O núcleo da estratégia é procurar oportunidades de negociação através da análise da relação entre o preço e o nível de CPR. A CPR é composta por um ponto central central (Pivot), uma linha central inferior (BC) e uma linha central superior (TC). Quando o preço ultrapassa o TC e o mercado está em uma fase de alta, o sistema emite um sinal de alta; quando o preço desce o BC e o mercado está em uma fase de baixa, o sistema emite um sinal de baixa.
Vantagens estratégicas
- Mecanismo de confirmação múltipla: combina a verificação tripla do comportamento dos preços, da direção da tendência e do volume de transação, aumentando a confiabilidade dos sinais de negociação
- Gerenciamento de risco dinâmico: Stop loss dinâmico baseado na largura do CPR, adaptado a diferentes cenários de mercado
- Opções de personalização flexíveis: ciclo de tempo de CPR ajustável, duração do EMA e confirmação de desvio de RSI on/off
- Desproporção de ganhos: o uso de uma proporção de ganhos e riscos de 1,5: 1 aumenta a rentabilidade a longo prazo
- Análise de períodos múltiplos: fornece uma visão mais abrangente do mercado através da integração de dados do dia e do horário
Risco estratégico
- Risco de Falso Breakout: Falso breakout pode ocorrer em mercados com turbulência, recomendando o uso de condições de filtragem de volume de transação mais rigorosas.
- Risco de reversão de tendência: um retorno maior pode ocorrer em pontos de reversão de tendência, o risco pode ser controlado reduzindo a faixa de parada
- Sensibilidade de parâmetros: o desempenho da estratégia é sensível a parâmetros como o comprimento da EMA e a queda do volume de transações, que precisam de otimização regular
- Dependência do cenário de mercado: a relação risco/benefício pode ser difícil de atingir em um cenário de baixa volatilidade
- Ponto de deslizamento de execução: pode haver um ponto de deslizamento maior em situações rápidas, afetando a eficácia da negociação real
Direção de otimização da estratégia
- Introdução de um mecanismo de auto-adaptação da taxa de flutuação: ajuste dos objetivos de stop loss e de ganho de acordo com a dinâmica da taxa de flutuação do mercado
- Aumentar a classificação de estados de mercado: tendências de segmentação e consolidar o mercado, com diferentes parâmetros de negociação
- Otimização do filtro de volume de transação: considerar a variação do volume de transação em vez de uma simples comparação de média
- Melhoria do mecanismo de saída: aumento do stop loss móvel e da função de encerramento parcial do lucro
- Adição de filtro de tempo: evitar negociações em períodos de tempo específicos, como períodos de alta volatilidade antes e depois do fechamento do mercado
Resumir
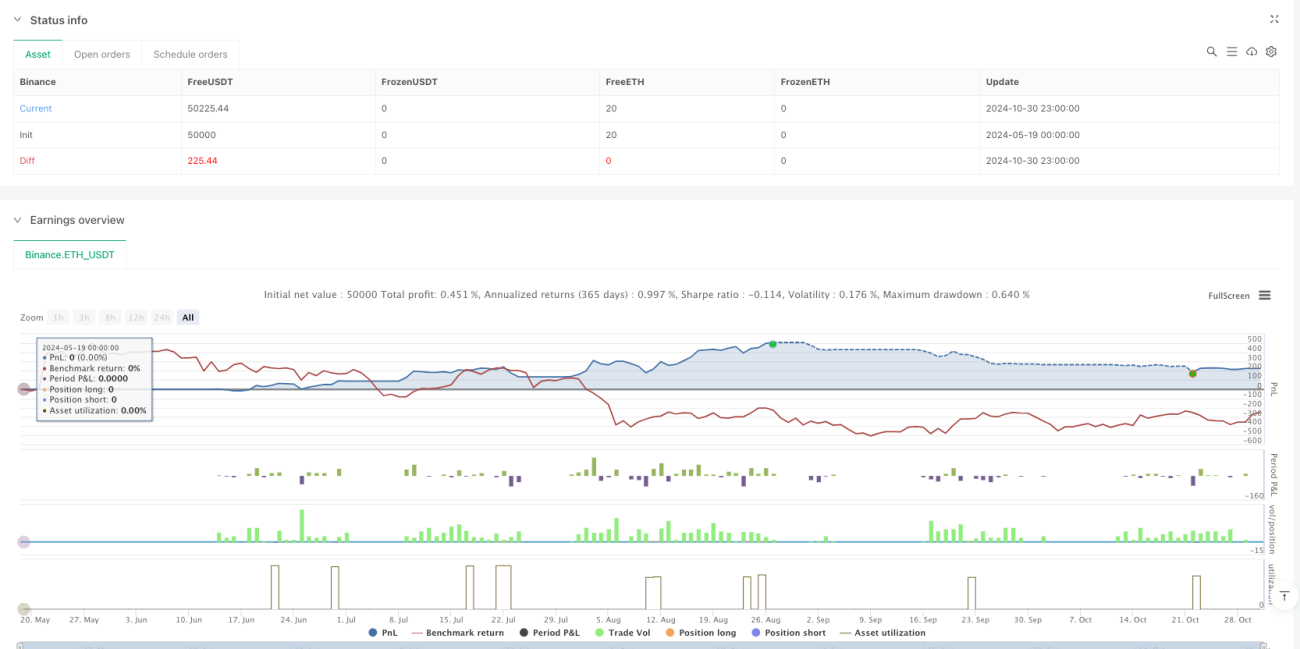
Trata-se de uma estratégia de acompanhamento de tendências com estrutura e lógica clara, que controla efetivamente o risco de negociação através da utilização conjunta de múltiplos indicadores técnicos. A principal vantagem da estratégia reside na sua configuração de parâmetros flexíveis e no seu mecanismo de gerenciamento de risco perfeito, mas também requer que o comerciante preste atenção às mudanças no ambiente do mercado e ajuste os parâmetros da estratégia em tempo hábil.
//@version=5
strategy("Ahmad Ali Khan CPR Strategy", overlay=true, margin_long=100, margin_short=100)

// ———— Inputs ————
use_daily_cpr = input.bool(true, "Use Daily CPR Levels")
ema_length = input.int(20, "EMA Trend Filter Length")
show_week_open = input.bool(true, "Show Weekly Open Price")
enable_divergence = input.bool(true, "Enable RSI Divergence Check")

// ———— Daily CPR Calculation ————
daily_high = request.security(syminfo.tickerid, "D", high[1], lookahead=barmerge.lookahead_on)
daily_low = request.security(syminfo.tickerid, "D", low[1], lookahead=barmerge.lookahead_on)- 1