
Overview
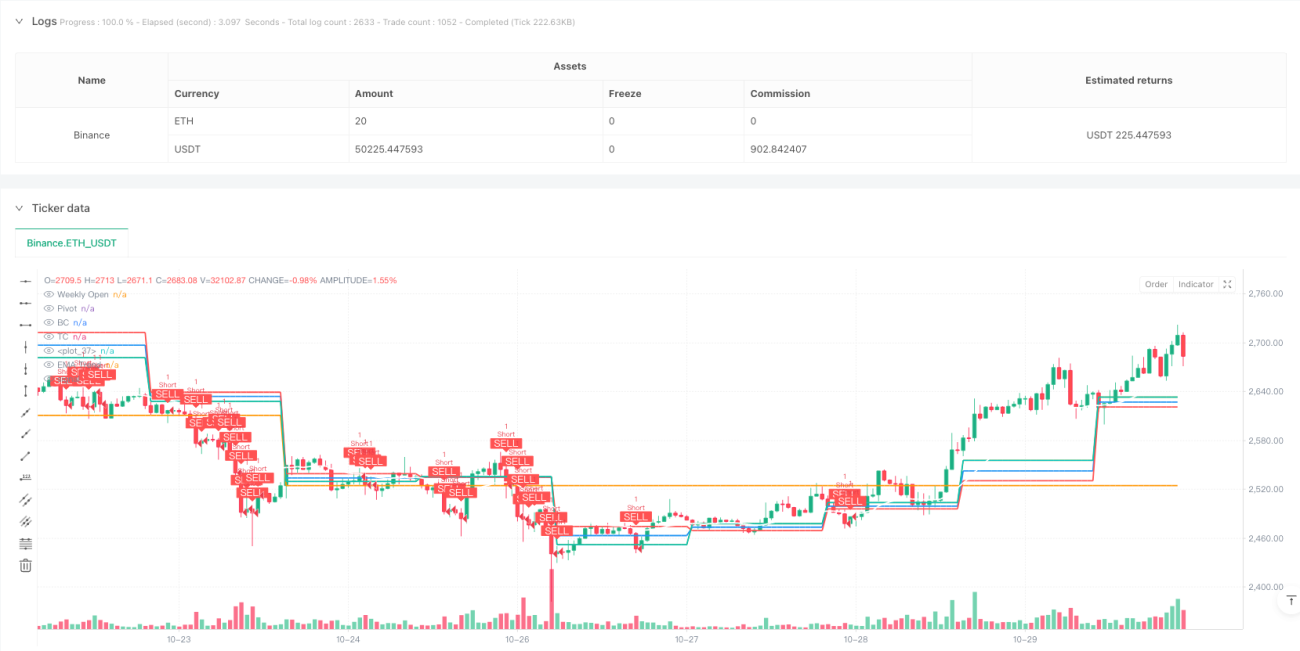
This strategy is a multi-timeframe trading system that utilizes Central Pivot Range (CPR), Exponential Moving Average (EMA), and Relative Strength Index (RSI) for trading decisions. It identifies market trends and key support/resistance levels using daily CPR levels, weekly open prices, and 20-period EMA, combined with volume confirmation for trade execution.
Strategy Principles
The core principle revolves around analyzing price relationships with CPR levels. CPR consists of Pivot Point, Bottom Central (BC), and Top Central (TC) lines. Long signals are generated when price breaks above TC in bullish market phases, while short signals occur when price breaks below BC in bearish phases. The system employs a 20-period EMA as a trend filter and requires volume above the 20-period average to confirm breakouts. Additionally, RSI divergence can be optionally used for extra confirmation.
Strategy Advantages
- Multiple confirmation mechanisms: Combines price action, trend direction, and volume triple confirmation to enhance signal reliability
- Dynamic risk management: Sets dynamic stop-losses based on CPR width, adapting to different market conditions
- Flexible customization options: Adjustable CPR timeframes, EMA length, and optional RSI divergence confirmation
- Asymmetric reward ratios: Employs 1.5:1 reward-to-risk ratio for improved long-term profitability
- Multi-timeframe analysis: Integrates daily and weekly data for a more comprehensive market perspective
Strategy Risks
- False breakout risk: May generate false signals in ranging markets, suggesting stricter volume filtering
- Trend reversal risk: Potential for larger drawdowns at trend turning points, manageable through tighter stops
- Parameter sensitivity: Strategy performance is sensitive to EMA length and volume threshold parameters
- Market environment dependency: May struggle to achieve target reward ratios in low volatility environments
- Execution slippage: Can face significant slippage in fast-moving markets, affecting actual trading results
Strategy Optimization Directions
- Implement volatility adaptation: Dynamically adjust stops and targets based on market volatility
- Enhanced market state classification: Differentiate between trending and ranging markets with separate parameters
- Refined volume filter: Consider relative volume changes instead of simple moving average comparison
- Improved exit mechanics: Add trailing stops and partial profit-taking functionality
- Time-based filtering: Avoid trading during specific periods like market open/close volatile sessions
Summary
This is a well-structured trend-following strategy with clear logic, effectively controlling trading risks through multiple technical indicators. Its main strengths lie in flexible parameter settings and comprehensive risk management mechanisms, though traders must remain attentive to changing market conditions and adjust parameters accordingly. Through the suggested optimization directions, the strategy's stability and profitability can be further enhanced.
//@version=5
strategy("Ahmad Ali Khan CPR Strategy", overlay=true, margin_long=100, margin_short=100)

// ———— Inputs ————
use_daily_cpr = input.bool(true, "Use Daily CPR Levels")
ema_length = input.int(20, "EMA Trend Filter Length")
show_week_open = input.bool(true, "Show Weekly Open Price")
enable_divergence = input.bool(true, "Enable RSI Divergence Check")

// ———— Daily CPR Calculation ————
daily_high = request.security(syminfo.tickerid, "D", high[1], lookahead=barmerge.lookahead_on)
daily_low = request.security(syminfo.tickerid, "D", low[1], lookahead=barmerge.lookahead_on)- 1