
This article introduces a trading strategy system that combines multiple technical indicators. The system integrates various technical analysis methods including MACD, EMA, Simple Moving Averages, and MA100, coupled with risk management and time filters, aimed at providing traders with a comprehensive trading solution.
Strategy Overview
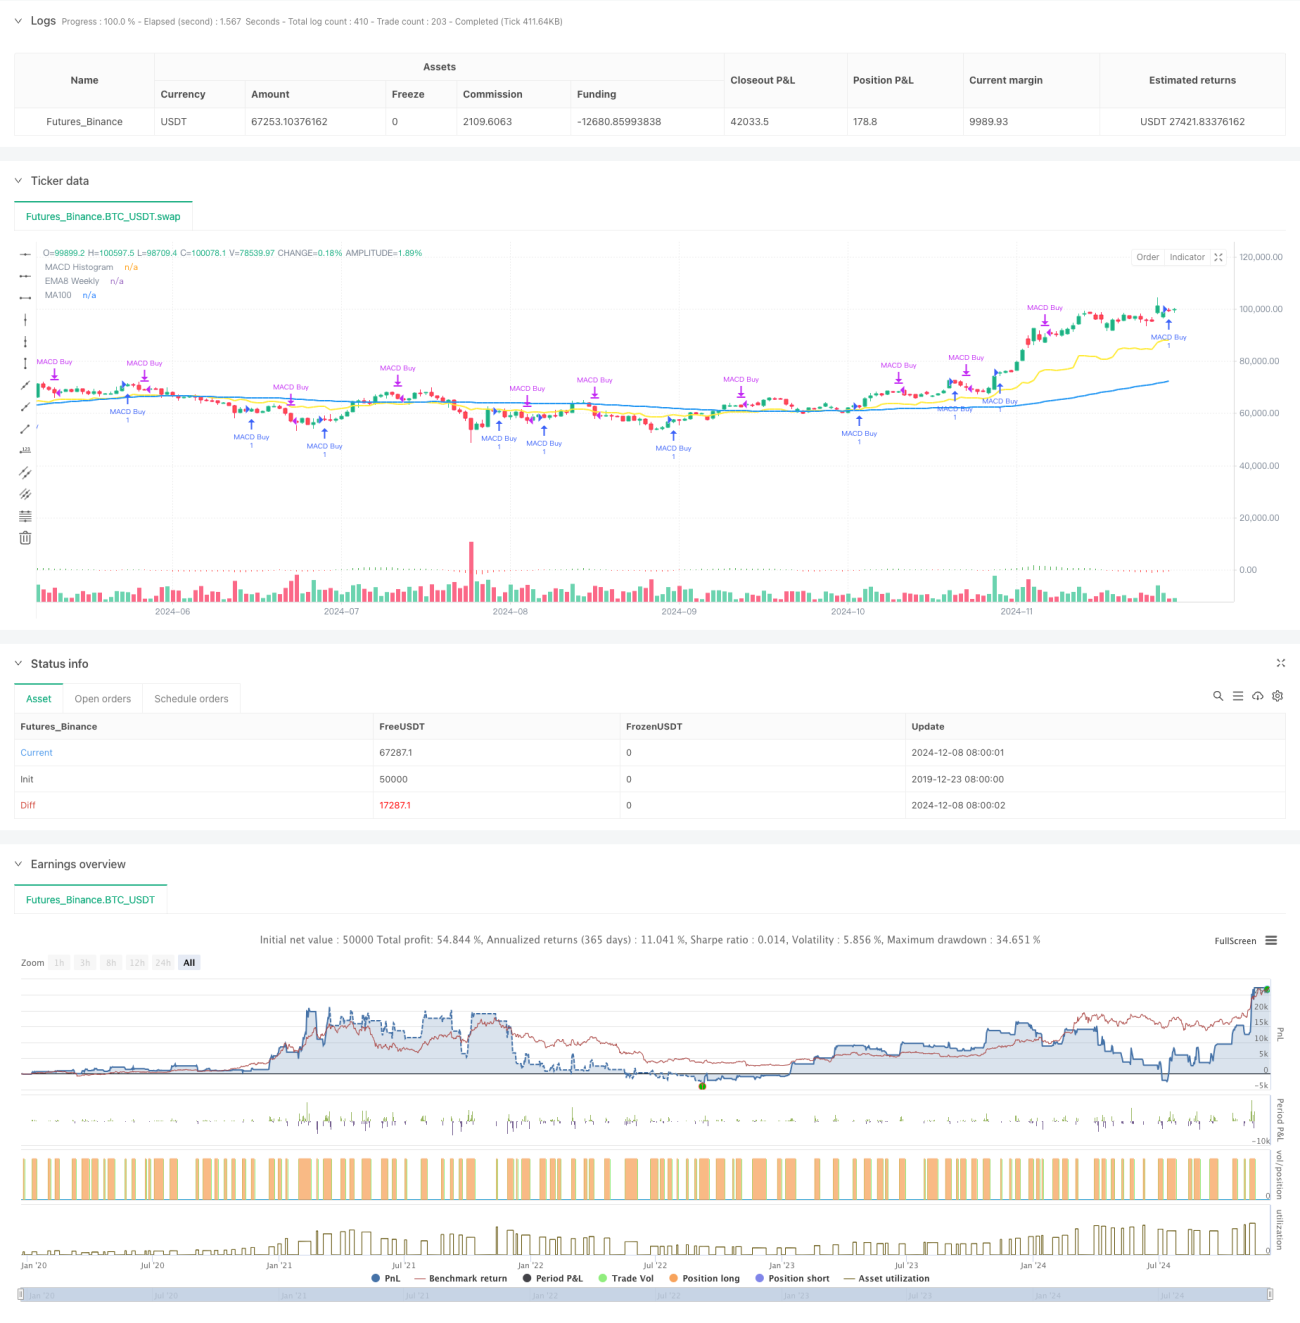
This strategy is a multi-strategy technical analysis system comprising four independent sub-strategies: MACD strategy, EMA8 strategy, Simple MA strategy, and MA100 strategy. The system allows traders to flexibly choose different strategy types based on market conditions, with each sub-strategy having its unique entry and exit logic, supported by corresponding risk management mechanisms.
Strategy Principles
-
MACD Strategy: Captures market trends by identifying consecutive rising and falling patterns in the MACD histogram. Buy signals are triggered by three consecutive rising histogram bars, while sell signals are triggered by two consecutive falling bars.
-
EMA8 Strategy: Combines weekly EMA8, previous highs, and candlestick pattern analysis. The system enters long positions when price breaks above the weekly EMA8, closes above previous highs, and shows strong candlestick patterns. This strategy includes a 2% stop-loss setting.
-
Simple MA Strategy: Utilizes multiple exponential moving averages (10,15,25,35,40 periods) to build a trend-following system. Buy signals are triggered when shorter-period MAs are above longer-period MAs and price breaks above the shortest-period MA. A 2% stop-loss is implemented.
-
MA100 Strategy: Combines 100-day MA, 8-day MA, and 25-day MA, incorporating stochastic oscillator for oversold conditions. The system looks for buying opportunities in oversold areas when short-term MAs are above long-term MAs and price fluctuates near MA100. This strategy employs a 3% stop-loss setting.
Strategy Advantages
- Multi-strategy Integration: Enhances system adaptability and stability through the combination of different technical analysis methods.
- Comprehensive Risk Control: Each sub-strategy is equipped with stop-loss mechanisms, effectively controlling single-trade risk.
- High Flexibility: Traders can select the most suitable strategy type based on market conditions.
- Multi-dimensional Analysis: Incorporates market analysis across multiple dimensions including trend, momentum, and volatility.
- Visualization Support: The system provides complete chart visualization functionality for better market understanding.
Strategy Risks
- Parameter Optimization Risk: Multiple technical indicators' parameters require periodic optimization, risking overfitting.
- Market Environment Dependency: Different sub-strategies perform differently under various market conditions, requiring correct selection.
- Signal Lag: Technical indicators inherently have lag, potentially leading to suboptimal entry or exit timing.
- False Breakout Risk: May generate numerous false signals in ranging markets.
Optimization Directions
- Add Market Environment Recognition Module: Recommend adding market condition judgment functionality for automatic sub-strategy selection.
- Improve Profit-Taking Mechanism: Dynamically adjust profit-taking levels based on different market conditions.
- Incorporate Volatility Filtering: Suggest introducing ATR indicator for volatility analysis to filter trading signals in low-volatility environments.
- Optimize Parameter Adaptation: Develop dynamic parameter adjustment mechanisms to improve system adaptability.
- Add Volume Analysis: Recommend incorporating volume confirmation mechanisms to enhance signal reliability.
Summary
This multi-strategy technical analysis trading system provides traders with a comprehensive trading decision framework by integrating multiple mature technical analysis methods. The system's main advantages lie in its flexibility and risk control capabilities, though it requires traders to have a deep understanding of markets for correct implementation. Through continuous optimization and improvement, this system has the potential to become an increasingly refined trading tool.
- 1