
Overview
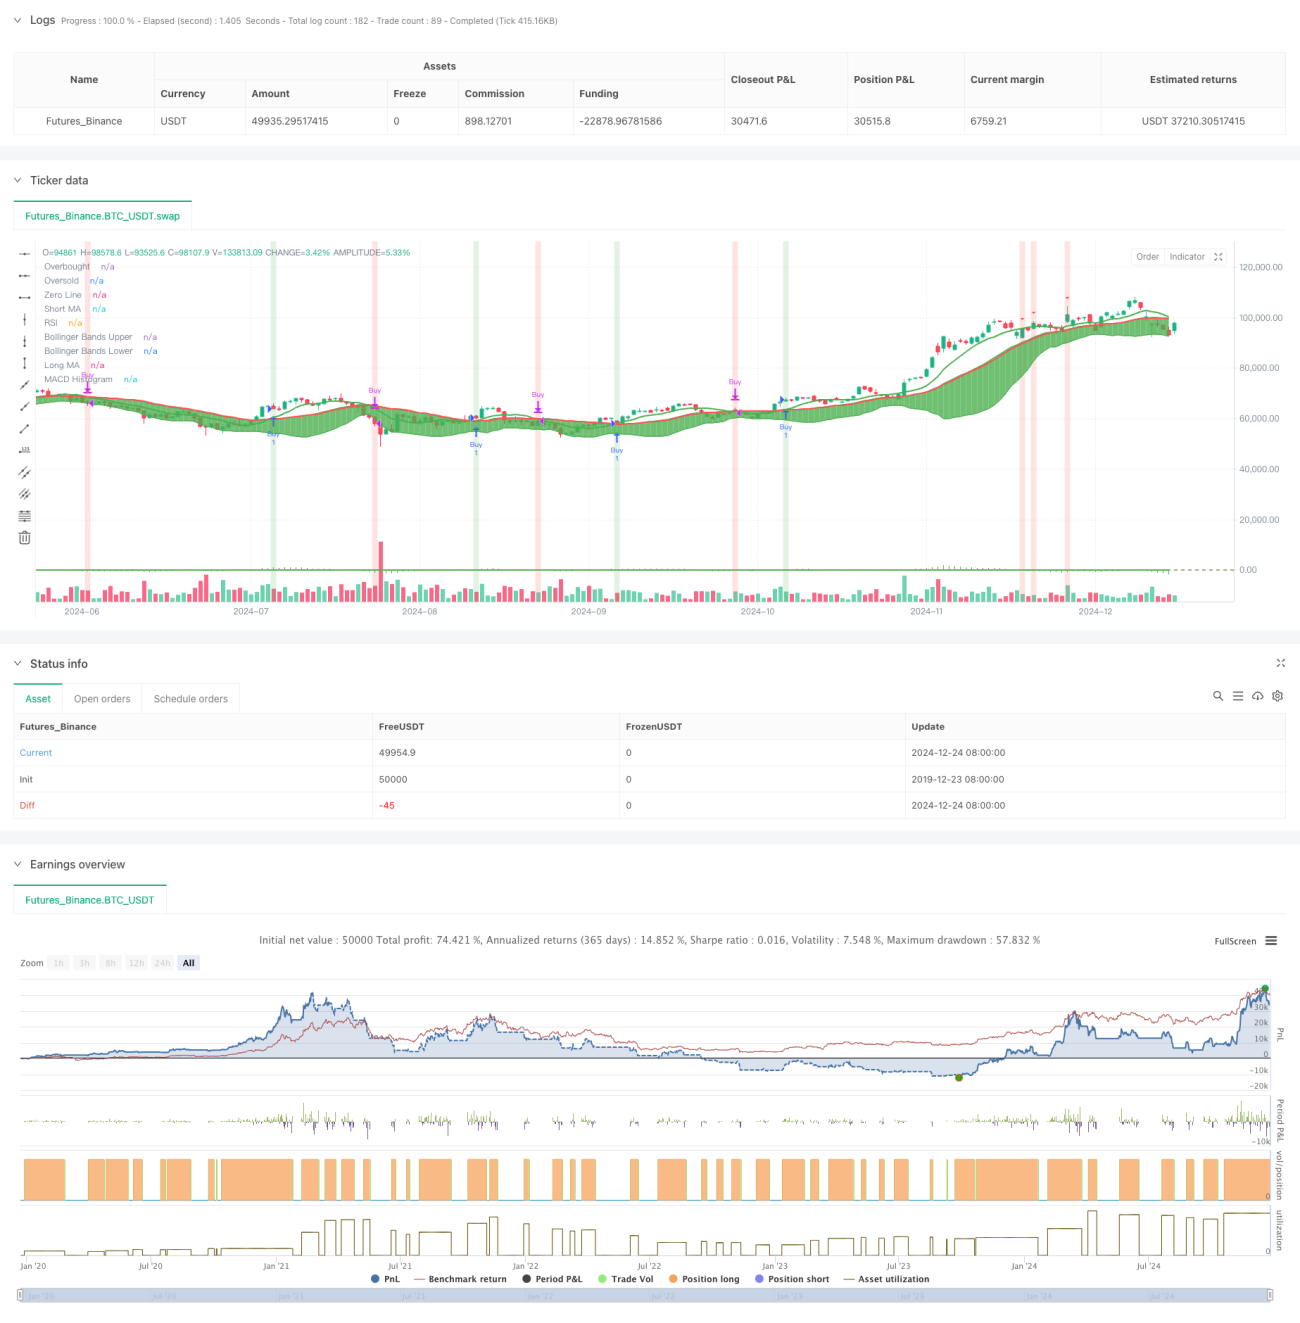
This strategy is a comprehensive trading system that combines multiple classic technical indicators, including Moving Average (MA), Relative Strength Index (RSI), Moving Average Convergence Divergence (MACD), and Bollinger Bands (BB). Through the coordination of these indicators, the system seeks more accurate buy/sell signals in the market to improve trading success rates.
Strategy Principles
The strategy employs a multi-layer signal verification mechanism, including:
- Using crossovers of short-term (9-day) and long-term (21-day) moving averages to determine basic trend direction
- Utilizing RSI (14-day) to identify overbought and oversold areas, with 70 and 30 as key levels
- Employing MACD (12,26,9) to confirm trend strength and potential turning points
- Using Bollinger Bands (20-day, 2 standard deviations) to judge price volatility range and potential reversal points
The system generates trading signals under the following conditions:
- Primary buy signal: Short-term MA crosses above long-term MA
- Primary sell signal: Short-term MA crosses below long-term MA
- Secondary buy signal: RSI below 30, MACD histogram positive, and price touches lower Bollinger Band
- Secondary sell signal: RSI above 70, MACD histogram negative, and price touches upper Bollinger Band
Strategy Advantages
- Multi-dimensional analysis: Provides a more comprehensive market analysis perspective by integrating multiple technical indicators
- Signal confirmation mechanism: Reduces false signals through the combination of primary and secondary signals
- Robust risk control: Controls entry point risk using the combination of Bollinger Bands and RSI
- Trend following capability: Captures main trends and identifies trend reversal points through MA and MACD combination
- Strong visualization: Provides clear graphical interface including background color prompts and shape markers
Strategy Risks
- Signal lag: Moving averages have inherent lag, potentially leading to suboptimal entry points
- Sideways market risk: May generate frequent false signals in ranging markets
- Indicator conflicts: Multiple indicators may sometimes generate contradictory signals
- Parameter sensitivity: Strategy effectiveness is sensitive to parameter settings, requiring thorough optimization
Strategy Optimization Directions
- Dynamic parameter adjustment: Automatically adjust indicator parameters based on market volatility
- Market environment classification: Add market environment identification mechanisms to use different signal combinations under different market conditions
- Stop-loss improvement: Incorporate more flexible stop-loss strategies, such as trailing stops or ATR-based stops
- Position management optimization: Dynamically adjust position sizes based on signal strength and market volatility
- Timeframe synchronization: Consider adding multiple timeframe analysis to improve signal reliability
Summary
This is a well-designed multi-dimensional trading strategy system that provides trading signals through the synergy of multiple technical indicators. The strategy's main advantages lie in its comprehensive analytical framework and rigorous signal confirmation mechanism, while attention needs to be paid to parameter optimization and market environment adaptability. Through the suggested optimization directions, this strategy has significant room for improvement.
- 1