
Visão geral
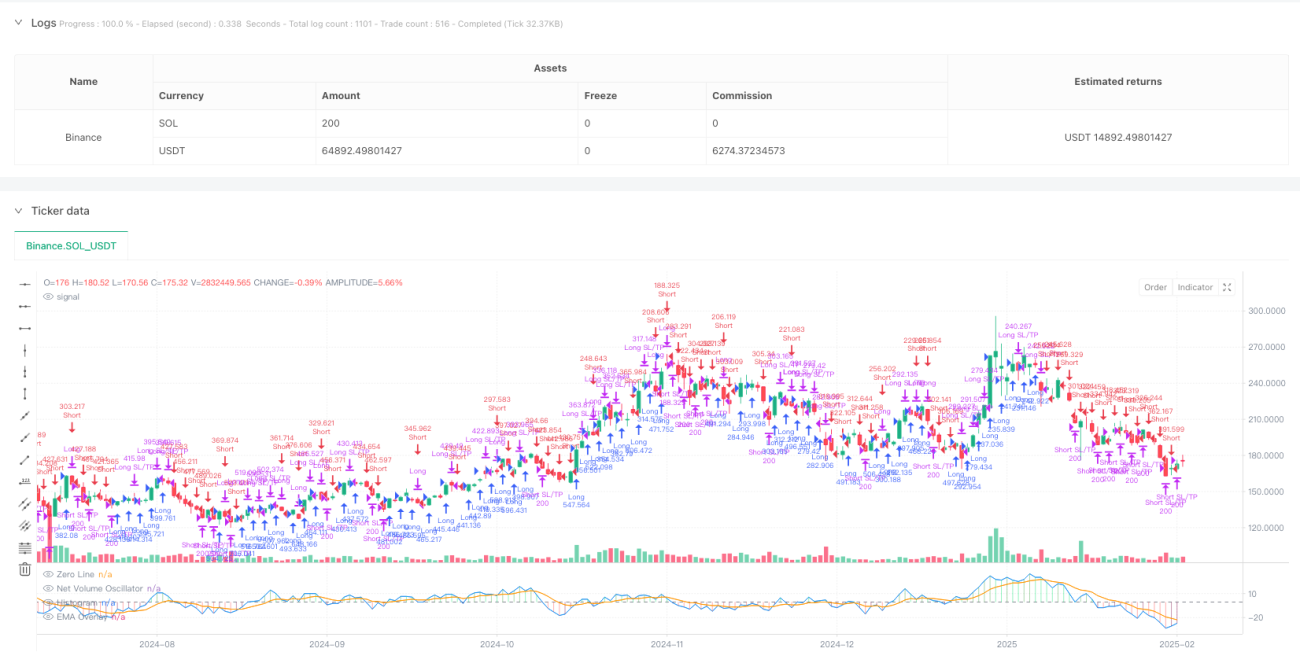
A estratégia é um sistema de acompanhamento de tendências baseado em volume de transações e mudanças de preços, que prevê a direção do mercado através da computação do indicador de volatilidade de volume de transações líquido (NVO). A estratégia combina vários tipos de médias móveis (EMA, WMA, SMA, HMA) para determinar a tendência do mercado, comparando a relação de posição do indicador de volatilidade com sua linha de sobreposição EMA, e para negociar no momento certo. A estratégia também inclui mecanismos de stop loss e stop loss para controlar o risco e bloquear os lucros.
Princípio da estratégia
O núcleo da estratégia é julgar o sentimento do mercado através da contagem de valores de oscilação de volume de negócios líquidos por dia. Os passos de cálculo são os seguintes:
- Calcular o múltiplo do intervalo de preços: um múltiplo entre 0-1 baseado no preço máximo, mínimo e de encerramento do dia
- Calcular o volume de transação que efetivamente sobe e desce: ponderando o volume de transação em função da direção da mudança de preço e multiplicando-o
- Calcular o volume de negócios líquido: subtrair o volume de negócios efetivamente aumentado do volume de negócios efetivamente diminuído
- Média móvel selecionada pelo aplicativo: processamento suave dos dados de volume de transação líquido
- Calculando a linha de sobreposição EMA: uma linha de referência para o julgamento de tendências
- Calcular a taxa de variação (ROC): para determinar a variação da intensidade da tendência
A geração de sinais de negociação baseia-se nas seguintes regras:
- Multicondicionamento: coloque uma linha de sobreposição de EMA no indicador de tremor
- Condições de vazio: atravessar a linha de sobreposição da EMA sob o indicador de tremor
- Stop Loss: Stop Loss baseado em percentagem
- Paragem: Paragem de preços baseada em percentagem
Vantagens estratégicas
- Análise multidimensional: informações de mercado em três dimensões: preço, volume de transação e taxa de variação de tendência
- Alta flexibilidade: suporte a vários tipos de médias móveis, que podem ser ajustadas de acordo com diferentes características do mercado
- Gerenciamento de risco perfeito: contém mecanismos de suspensão de prejuízos para controlar os riscos de forma eficaz
- Forte visualização: mudanças na intensidade da tendência através de gráficos rectângulos, facilitando a compreensão do estado do mercado
- Adaptabilidade: adaptação a diferentes ambientes de mercado e variedades de negociação por meio de um design parametrizado
Risco estratégico
- Risco de reversão de tendência: falsos sinais frequentes em mercados turbulentos
- Risco de atraso: a própria média móvel tem um certo atraso, o que pode levar a que o tempo de entrada e saída não seja o ideal
- Sensibilidade dos parâmetros: Diferentes combinações de parâmetros podem levar a grandes diferenças no desempenho da estratégia
- Dependência do cenário de mercado: pode ter um desempenho fraco em certos cenários de mercado
- Limitações técnicas: baseia-se apenas em indicadores técnicos, sem considerar os fatores fundamentais
Sugestões de controle de risco:
- Recomendação de otimização de parâmetros em diferentes cenários de mercado
- Pode ser combinado com outros indicadores técnicos para a confirmação de sinais
- Ajustar adequadamente os parâmetros de stop loss para adaptar-se às diferentes volatilidades do mercado
Direção de otimização da estratégia
-
Mecanismos de confirmação de sinais:
- Aumento da condição de confirmação de volume
- Adicionar filtro de força de tendência
- Introdução de um mecanismo adaptativo de volatilidade
-
Otimização da gestão de riscos:
- Implementando um mecanismo de stop loss dinâmico
- Adição de módulo de gestão de fundos
- Introdução de mecanismos de construção e redução de estoque por lotes
-
Parâmetros de otimização:
- Desenvolvimento de mecanismos de ajuste de parâmetros de adaptação
- Realização de comutação de parâmetros baseada em cenários de mercado
- Adicionar um modelo de aprendizado de máquina para otimização de parâmetros
Resumir
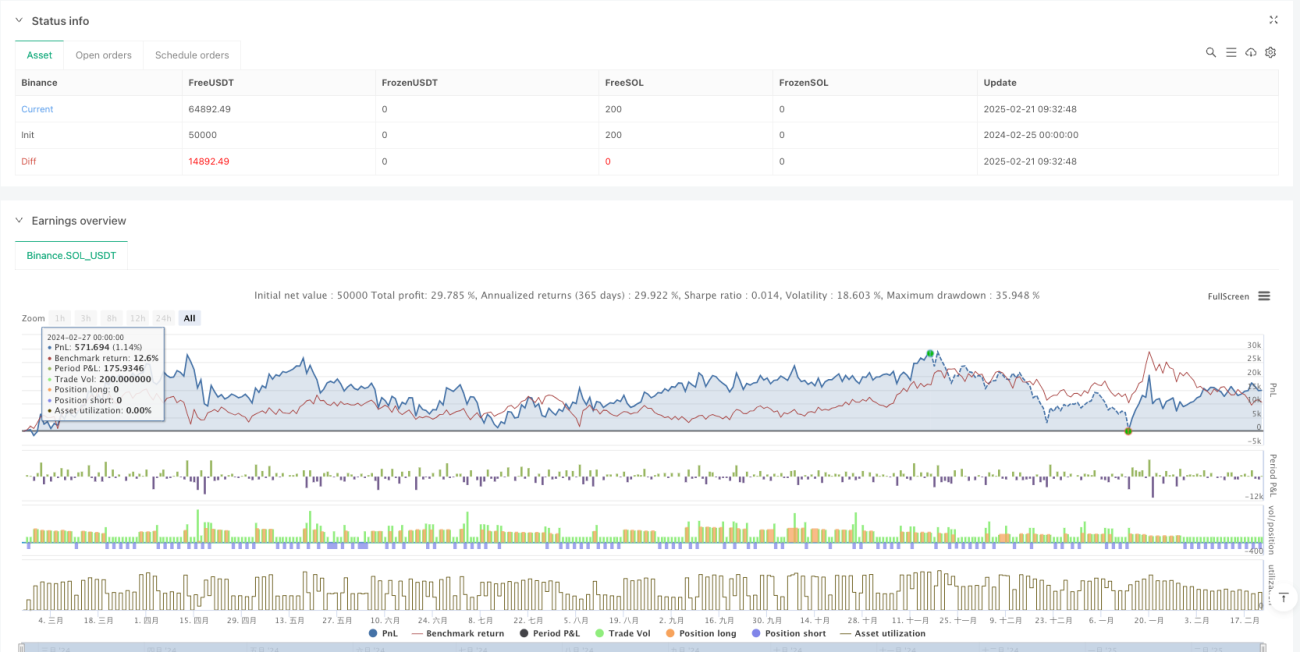
A principal característica da estratégia é a combinação de vários indicadores técnicos e oferece opções de configuração de parâmetros flexíveis. Apesar de existir um certo risco, a estratégia espera obter um retorno estável na negociação real através de um controle razoável do risco e otimização contínua. É recomendado que os comerciantes façam um bom feedback antes de usar no mercado real e ajustar adequadamente os parâmetros de acordo com as condições específicas do mercado.
/*backtest
start: 2024-02-25 00:00:00
end: 2025-02-22 08:00:00
period: 1d
basePeriod: 1d
exchanges: [{"eid":"Binance","currency":"SOL_USDT"}]
*/

//@version=5
strategy("EMA-Based Net Volume Oscillator with Trend Change", shorttitle="NVO Trend Change", overlay=false, initial_capital=100000, default_qty_type=strategy.percent_of_equity, default_qty_value=100)

// Input parameters- 1