
Visão Geral
A estratégia de acompanhamento adaptativo de tendência ALMA-ATR multifatorial é um sistema de negociação abrangente que combina vários indicadores técnicos para otimizar os momentos de entrada e saída. O núcleo da estratégia utiliza a ALMA (Média Móvel de Arnaud Legoux) como principal ferramenta de identificação de tendência, integrando simultaneamente um filtro de volatilidade baseado no ATR, confirmação de momento pelo RSI, validação da intensidade da tendência pelo ADX e um mecanismo de controle de volatilidade das Bandas de Bollinger. A estratégia também incorpora o sistema UT Bot, um sistema de trailing stop e sinalização baseado no ATR, para aumentar a precisão das saídas das operações.
Princípio da Estratégia
O princípio central da estratégia é operar através da ação sinérgica de múltiplos indicadores técnicos, garantindo que a tendência esteja clara e a volatilidade seja moderada. Especificamente:
- Utiliza a ALMA como principal indicador de tendência. Comparada às EMAs ou SMAs tradicionais, a ALMA é mais suave e apresenta menor defasagem.
- Implementa um filtro de volatilidade: exige que o valor do ATR esteja acima de um limite mínimo definido, assegurando que o mercado tenha volatilidade suficiente.
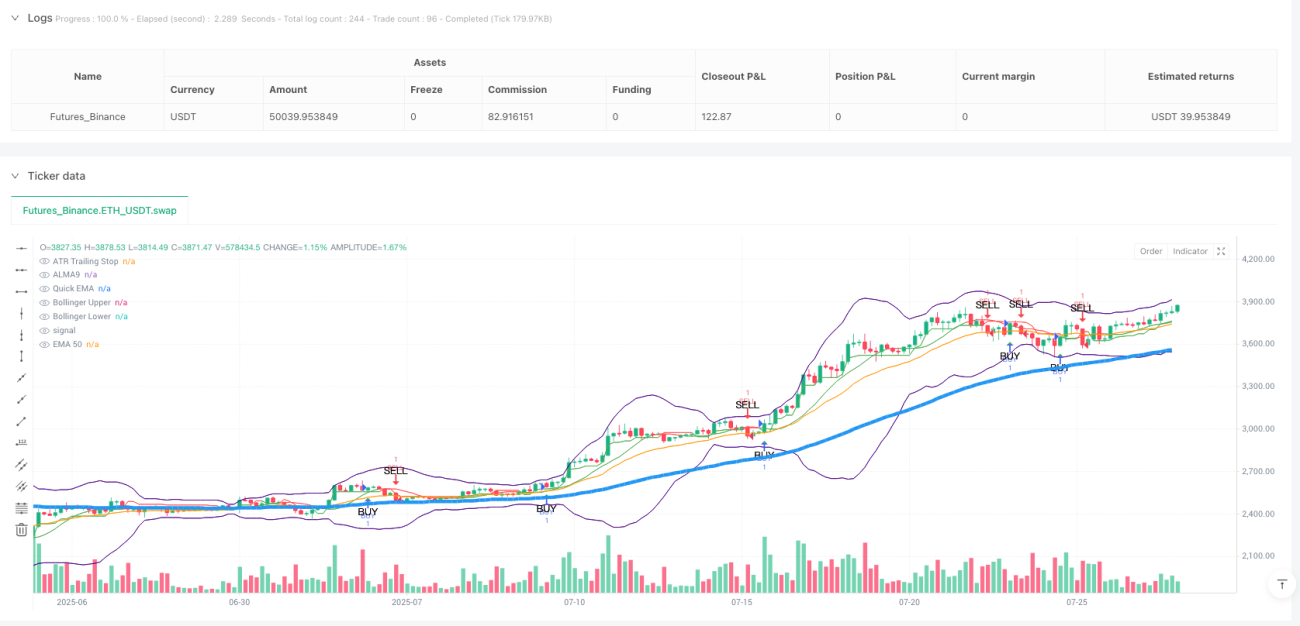
- As condições de entrada incluem: preço acima da EMA50 e da ALMA9, RSI acima do nível de sobrevenda e superior a 30, ADX maior que 30 (indicando tendência forte), preço abaixo da banda superior de Bollinger e atendimento ao requisito de período de resfriamento.
- Condições de saída: preço caindo abaixo da EMA rápida, ou acionamento do stop loss/take profit baseado no ATR, ou alcance da condição de saída por tempo.
- Integra o sistema UT Bot, utilizando uma linha de trailing stop baseada no ATR para fornecer um mecanismo de proteção adicional às operações.
A estratégia adota uma abordagem dinâmica de gerenciamento de risco, onde os níveis de stop loss e take profit são calculados com base no ATR, permitindo que a estratégia se adapte às mudanças de volatilidade em diferentes condições de mercado.
Análise de Vantagens
A estratégia apresenta as seguintes vantagens significativas:
- Mecanismo de Confirmação Múltipla: Ao integrar vários indicadores técnicos (ALMA, RSI, ADX, Bandas de Bollinger, etc.), aumenta a confiabilidade dos sinais e reduz sinais falsos.
- Alta Adaptabilidade: Os níveis dinâmicos de stop loss e take profit baseados no ATR permitem que a estratégia se adapte às mudanças na volatilidade do mercado.
- Captura Eficaz de Tendências: A baixa defasagem da ALMA, combinada com a confirmação da força da tendência pelo ADX, ajuda a capturar mudanças de tendência em tempo hábil.
- Controle de Risco Robusto: Através de filtro de volatilidade, stop loss dinâmico e mecanismo de período de resfriamento, oferece proteção de risco em múltiplos níveis.
- Visualização Clara: A estratégia marca sinais de compra e venda no gráfico, facilitando a compreensão intuitiva das condições de mercado pelos traders.
- Alta Flexibilidade: Através do ajuste de parâmetros, a estratégia pode se adaptar a diferentes ambientes de mercado e períodos de negociação.
Análise de Riscos
Embora a estratégia seja bem projetada, ainda existem os seguintes riscos potenciais:
- Risco de Otimização de Parâmetros: A otimização excessiva dos parâmetros pode fazer com que a estratégia tenha bom desempenho em dados históricos, mas resultados ruins em negociações reais.
Solução: Utilizar testes forward e validação com dados fora da amostra para garantir a robustez dos parâmetros. - Risco de Reversão de Tendência: Em reversões fortes de tendência, a estratégia pode não reagir com rapidez suficiente, resultando em perda de lucros.
Solução: Considerar a adição de indicadores de alerta de reversão de tendência, como osciladores de momento ou análise de volume. - Risco de Excesso de Negociações: Em mercados laterais, podem ser gerados muitos sinais de negociação.
Solução: Reforçar as condições do filtro de volatilidade, ou pausar as negociações após identificar um mercado lateral. - Risco de Armadilha de Stop Loss: O mercado pode acionar o stop loss e depois retomar rapidamente a tendência original.
Solução: Considerar o uso de estratégias de stop loss gradual ou ajustar dinamicamente o múltiplo do stop loss de acordo com as condições do mercado. - Risco de Defasagem: Embora a ALMA tenha menor defasagem, todos os indicadores técnicos apresentam inerentemente algum grau de defasagem.
Solução: Considerar a adição de indicadores prospectivos ou otimizar as configurações dos parâmetros da ALMA.
Direções de Otimização
Com base na análise da estratégia, sugerem-se as seguintes direções de otimização:
- Classificação do Estado do Mercado: Introduzir um mecanismo de identificação do estado do mercado para utilizar diferentes configurações de parâmetros em diferentes estados (tendência, lateral, alta volatilidade, etc.). Isso pode melhorar a adaptabilidade da estratégia em vários ambientes de mercado.
- Integração de Volume: Incorporar indicadores de volume na estratégia como ferramenta auxiliar de confirmação de tendência, aumentando a confiabilidade dos sinais.
- Análise de Múltiplos Timeframes: Introduzir um mecanismo de confirmação em múltiplos timeframes para garantir que a direção da negociação esteja alinhada com a tendência de um timeframe superior.
- Otimização por Machine Learning: Utilizar algoritmos de aprendizado de máquina para ajustar dinamicamente os parâmetros ou prever os melhores pontos de entrada/saída.
- Melhoria na Estratégia de Take Profit: Implementar take profit gradual ou take profit dinâmico baseado na estrutura do mercado para aumentar a eficiência do uso do capital.
- Pontuação de Qualidade do Sinal: Desenvolver um sistema de pontuação de qualidade do sinal, executando negociações apenas quando a intensidade do sinal ultrapassar um limiar específico.
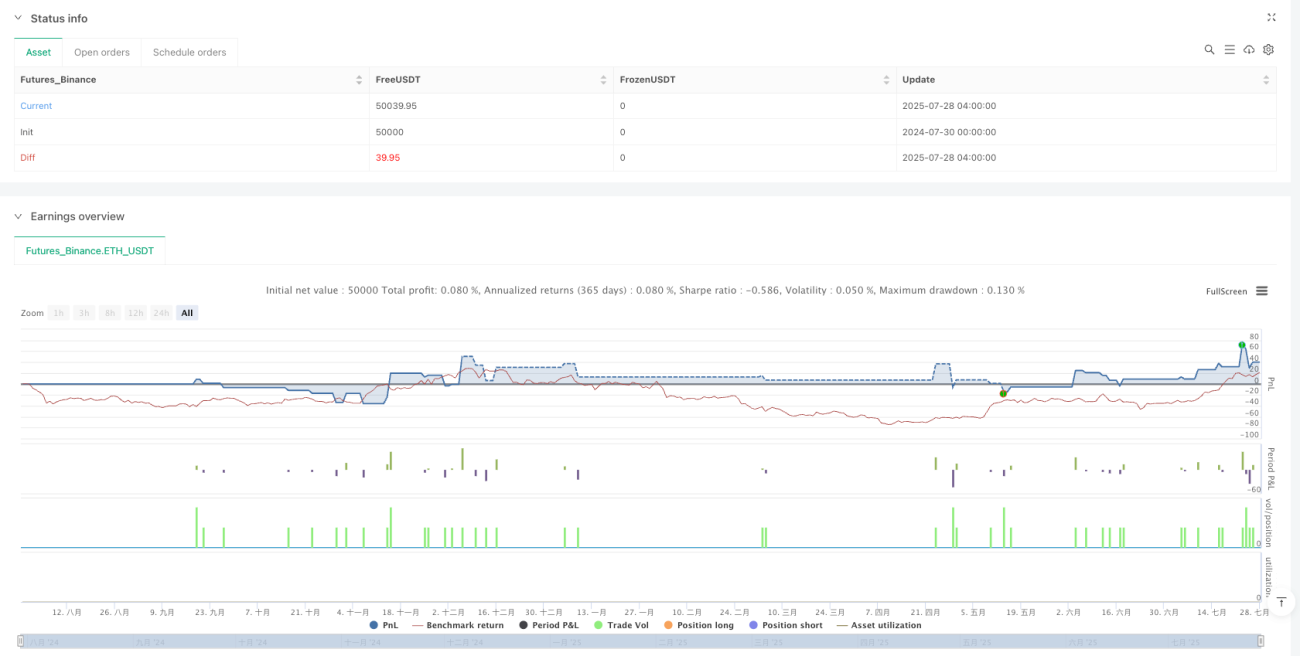
- Controle de Drawdown: Introduzir um mecanismo de controle de posição geral, reduzindo a posição ou pausando as negociações quando o drawdown exceder um nível específico.
O objetivo dessas direções de otimização é aumentar a robustez da estratégia, reduzir o drawdown e manter um desempenho consistente em diferentes ambientes de mercado.
Resumo
A estratégia de acompanhamento adaptativo de tendência ALMA-ATR multifatorial é um sistema de negociação abrangente com controle de risco robusto. Ao integrar múltiplas ferramentas técnicas como ALMA, ATR, RSI, ADX, Bandas de Bollinger e UT Bot, a estratégia consegue identificar tendências de forma eficaz, filtrar ruídos, controlar riscos e entrar e sair nos momentos adequados. A principal vantagem da estratégia reside em seu mecanismo de confirmação múltipla e sistema de gerenciamento de risco adaptativo, que lhe permite manter um desempenho estável em diferentes ambientes de mercado.
Ainda assim, qualquer estratégia de negociação enfrenta desafios decorrentes da incerteza do mercado. Através da otimização contínua das configurações de parâmetros, introdução de classificação do estado do mercado, integração de análise de múltiplos timeframes e outros métodos, a estratégia ainda possui grande potencial de melhoria. Para traders quantitativos, esta é uma estratégia com uma base sólida que pode ser customizada e otimizada de acordo com a tolerância ao risco e compreensão do mercado de cada indivíduo.
- 1