EMA inFusion Pro Estratégia de Fusão de Dados de Múltiplas Fontes

🎯 Destaques Principais da Estratégia: Estratégia EMA que vai além do preço
Você sabia? A maioria das pessoas usa EMA apenas para observar o preço, mas o que torna esta estratégia especial? Ela calcula EMA a partir de 6 fontes de dados diferentes! É como cozinhar – não usamos apenas sal para temperar, mas também açúcar, vinagre, molho de soja, proporcionando sinais de negociação mais ricos.
Atenção! Estas 6 fontes de dados incluem: preço normal, volume, taxa de variação, preço médio dos candles, volume médio dos candles, taxa de variação média dos candles. Cada uma oferece uma visão diferente do mercado!
📊 Sistema de Tripla Filtragem: Sinais mais precisos
Esta estratégia não gera sinais aleatoriamente! Ela passa por três "verificações de segurança":
Primeira: Identificação da tendência EMA 📈
Como uma previsão do tempo, primeiro determine se a direção principal é de sol ou chuva
Segunda: Filtro de força ADX 💪
ADX é como um instrumento que mede a força do vento – só emite sinais quando a tendência é forte o suficiente (padrão acima de 25). Evita ser "atingido" em mercados laterais!
Terceira: Confirmação por volume 🔊
Um aumento repentino no volume é como se a ação estivesse "falando alto", provando que o sinal é sério, não uma brincadeira
🎮 Três Modos de Saída: Adaptados a diferentes estilos de negociação
O mais interessante é que esta estratégia oferece 3 modos de saída, como um jogo com três níveis de dificuldade: fácil, médio, difícil
Modo 1: Saída por sinal contrário 🔄
O mais simples e direto – quando surge um sinal de alta, fecha a posição vendida e abre comprada; quando surge um sinal de baixa, fecha a posição comprada e abre vendida
Modo 2: Stop dinâmico ATR (Take Profit/Stop Loss) 📏
Ajusta-se automaticamente de acordo com a volatilidade do mercado – quando a volatilidade é alta, o stop é mais amplo; quando é baixa, o stop é mais apertado
Modo 3: Stop Loss/Take Profit percentual fixo 📊
Mais fácil de entender – lucro de 2% sai, perda de 1,5% encerra (personalizável)
🚀 Sugestões de Aplicação Prática
Ciclos indicados: Negociação de curto a médio prazo, especialmente adequada para mercados com certa volatilidade
Guia para evitar armadilhas: Cuidado em mercados laterais – recomenda-se ativar o filtro ADX
Uso avançado: Experimente diferentes fontes de dados – a fonte de volume é particularmente eficaz em rompimentos com aumento de volume!
A maior vantagem desta estratégia é sua forte flexibilidade – você pode escolher a fonte de dados e o modo de saída mais adequados conforme as diferentes condições de mercado. Lembre-se: não existe estratégia perfeita, apenas a estratégia mais adequada para o mercado atual!
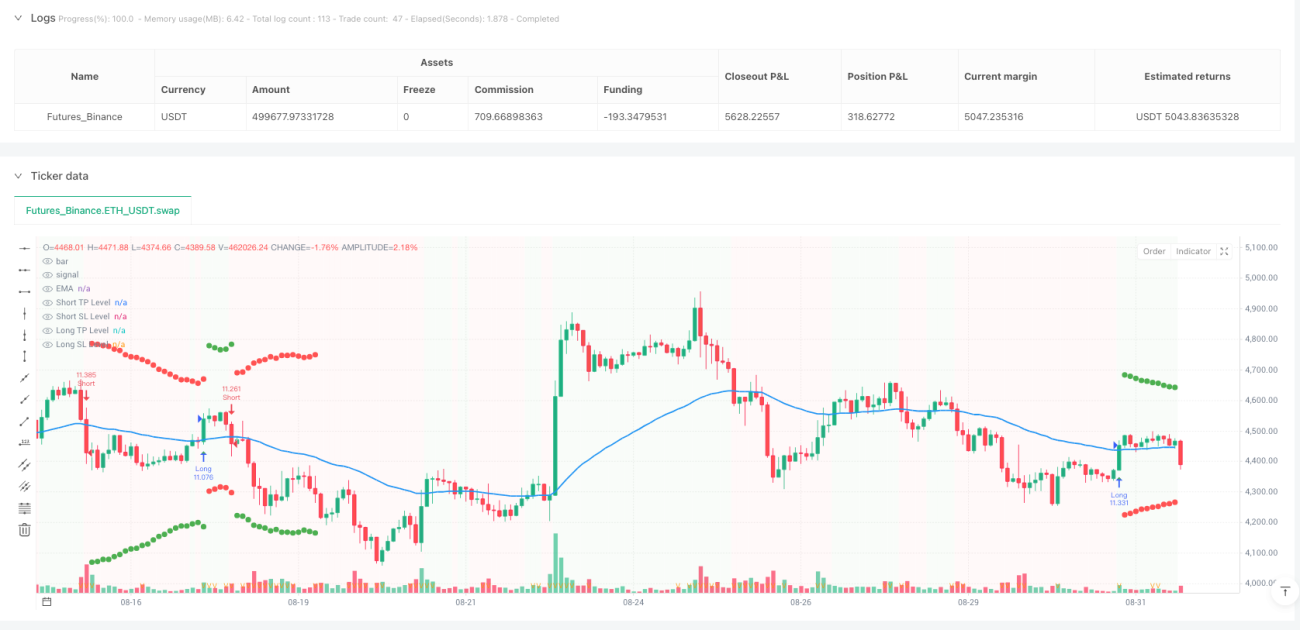
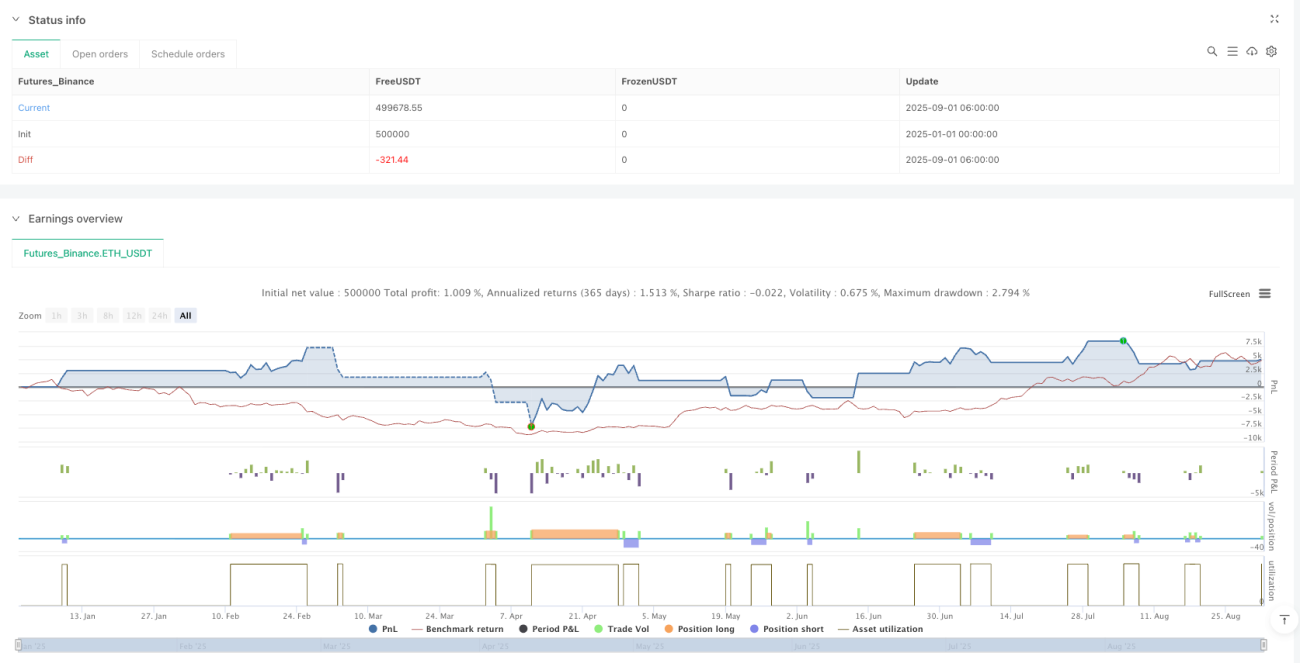
/*backtest
start: 2025-01-01 00:00:00
end: 2025-09-01 08:00:00
period: 2h
basePeriod: 2h
exchanges: [{"eid":"Futures_Binance","currency":"ETH_USDT","balance":500000}]
*/

//@version=5
//@fenyesk
strategy("EMA inFusion Pro - Source Selection", overlay=true, initial_capital=10000, default_qty_type=strategy.percent_of_equity, default_qty_value=10)
- 1