Многопериодная сглаженная система отслеживания тренда Heikin Ashi с количественной оценкой

Обзор
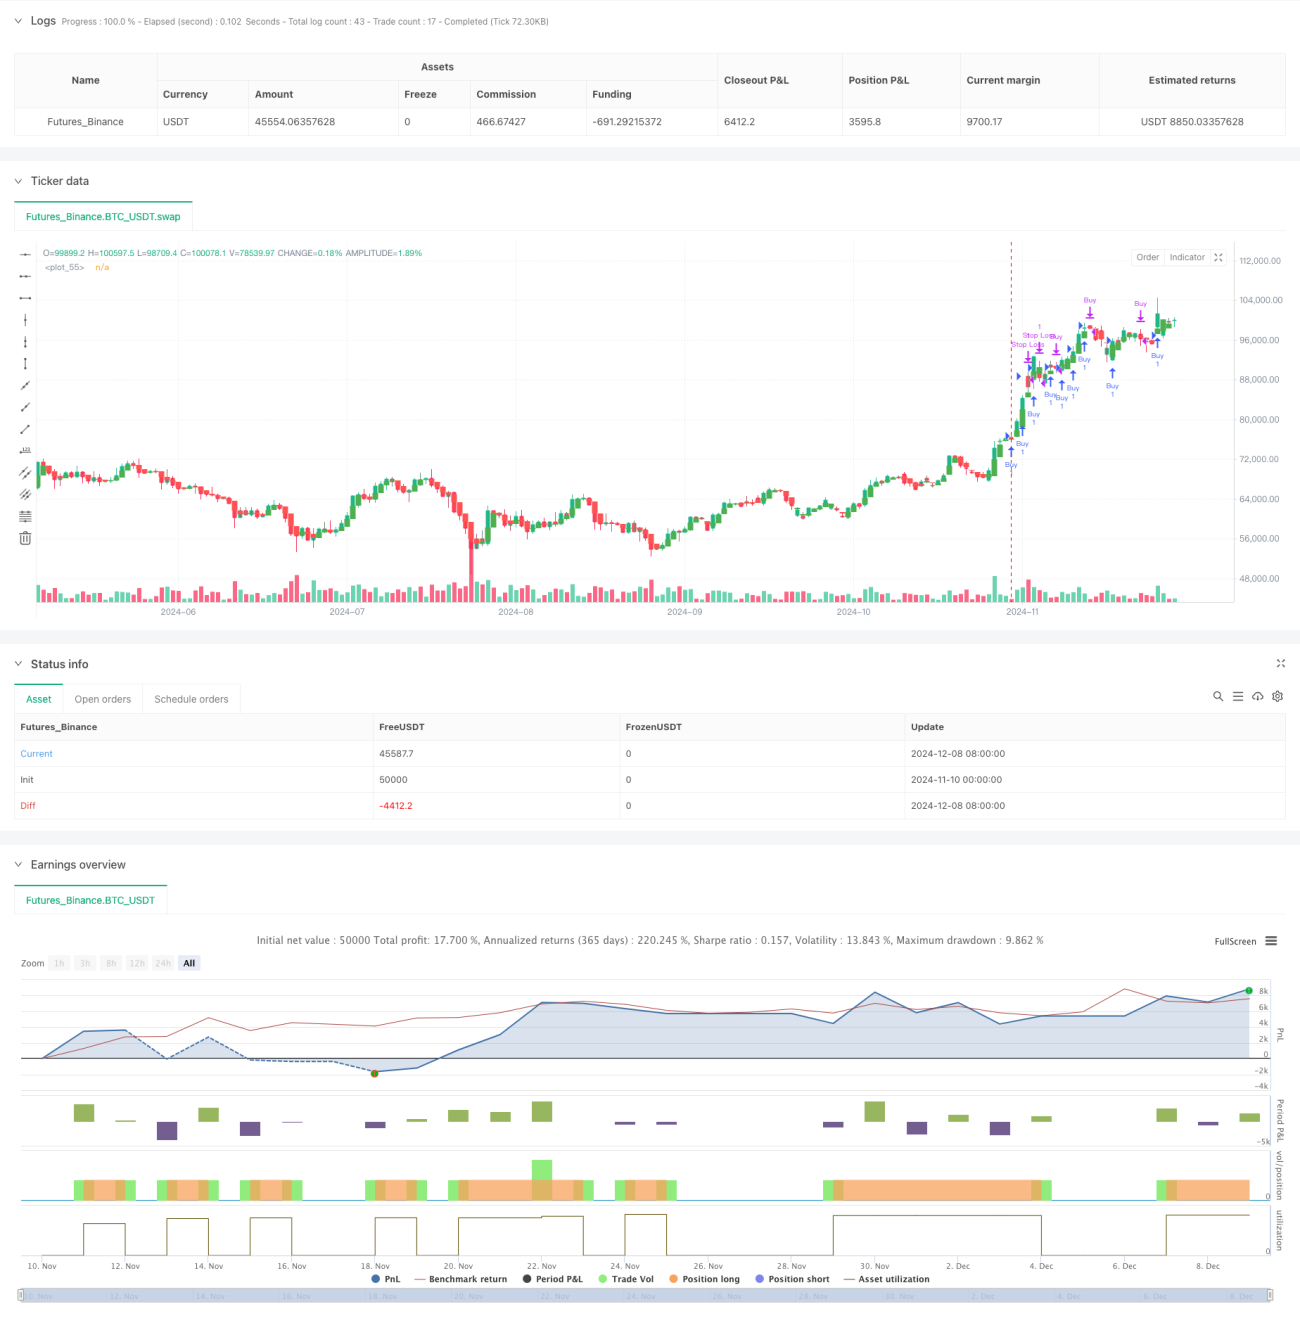
Эта стратегия является системой отслеживания тенденций, основанной на гладком графике Heikin Ashi. Эффективно снижает влияние рынка шума, рассчитывая график Heikin Ashi в более высоких временных периодах и применяя его к торговым решениям в более низких временных периодах.
Стратегический принцип
Основная логика стратегии заключается в том, чтобы использовать гладкие свойства диаграммы Heikin Ashi для идентификации тенденций в высоких временных периодах. Диаграмма Heikin Ashi эффективно фильтрует рыночный шум, выделяя основные тенденции путем вычисления движущихся средних по цене открытия и закрытия.
Стратегические преимущества
- Многоциклическая комбинация уменьшает ложные сигналы: эффективно уменьшает помехи, вызванные краткосрочными колебаниями, путем расчета показателя Heikin Ashi на более высоких временных периодах.
- Усовершенствованный риск-менеджмент: интегрированная функция остановки убытков, позволяющая гибко корректировать параметры в зависимости от рыночных колебаний.
- Гибкость в выборе направления: в зависимости от рыночных особенностей можно выбрать только плюс, только минус или двустороннюю торговлю.
- Полностью автоматизированная работа: четкая логика стратегии, регулируемые параметры, подходящие для автоматизированной торговли.
- Умение адаптироваться: может применяться в различных рынках и временных периодах, имеет хорошую универсальность.
Стратегический риск
- Риск поворота тренда: при повороте тренда может произойти большое отступление, требующее разумной установки стоп-лосса.
- Риск колебания рынка: частое торгование на колебаниях может привести к убыткам.
- Риск параметрической оптимизации: чрезмерная оптимизация может привести к тому, что стратегия будет плохо работать в реальном мире.
- Риск скольжения затрат: частые транзакции могут привести к более высоким транзакционным затратам.
Направление оптимизации стратегии
- Добавление индикатора подтверждения тенденции: могут быть введены другие технические индикаторы, такие как RSI или MACD, в качестве вспомогательного подтверждения.
- Оптимизированный механизм остановки убытков: можно реализовать отслеживаемую остановку или динамическую остановку на основе волатильности.
- Внедрение объемного анализа: объединение объемных показателей повышает надежность входных сигналов.
- Разработка параметров адаптации: автоматическая корректировка стоп-стоп в зависимости от рыночных колебаний.
- Добавление временной фильтрации: избегайте частых сделок в неактивные периоды времени.
Подвести итог
Стратегия эффективно улавливает рыночные тенденции благодаря гладким свойствам многоциклического индикатора Heikin Ashi и контролирует отступление благодаря хорошо продуманному механизму управления рисками. Гибкость и масштабируемость стратегии делают ее полезной, способной приспосабливаться к различным рыночным условиям путем постоянной оптимизации и улучшения. Несмотря на определенные риски, стабильная торговая эффективность может быть достигнута с помощью разумной настройки параметров и управления рисками.
- 1