Обзор
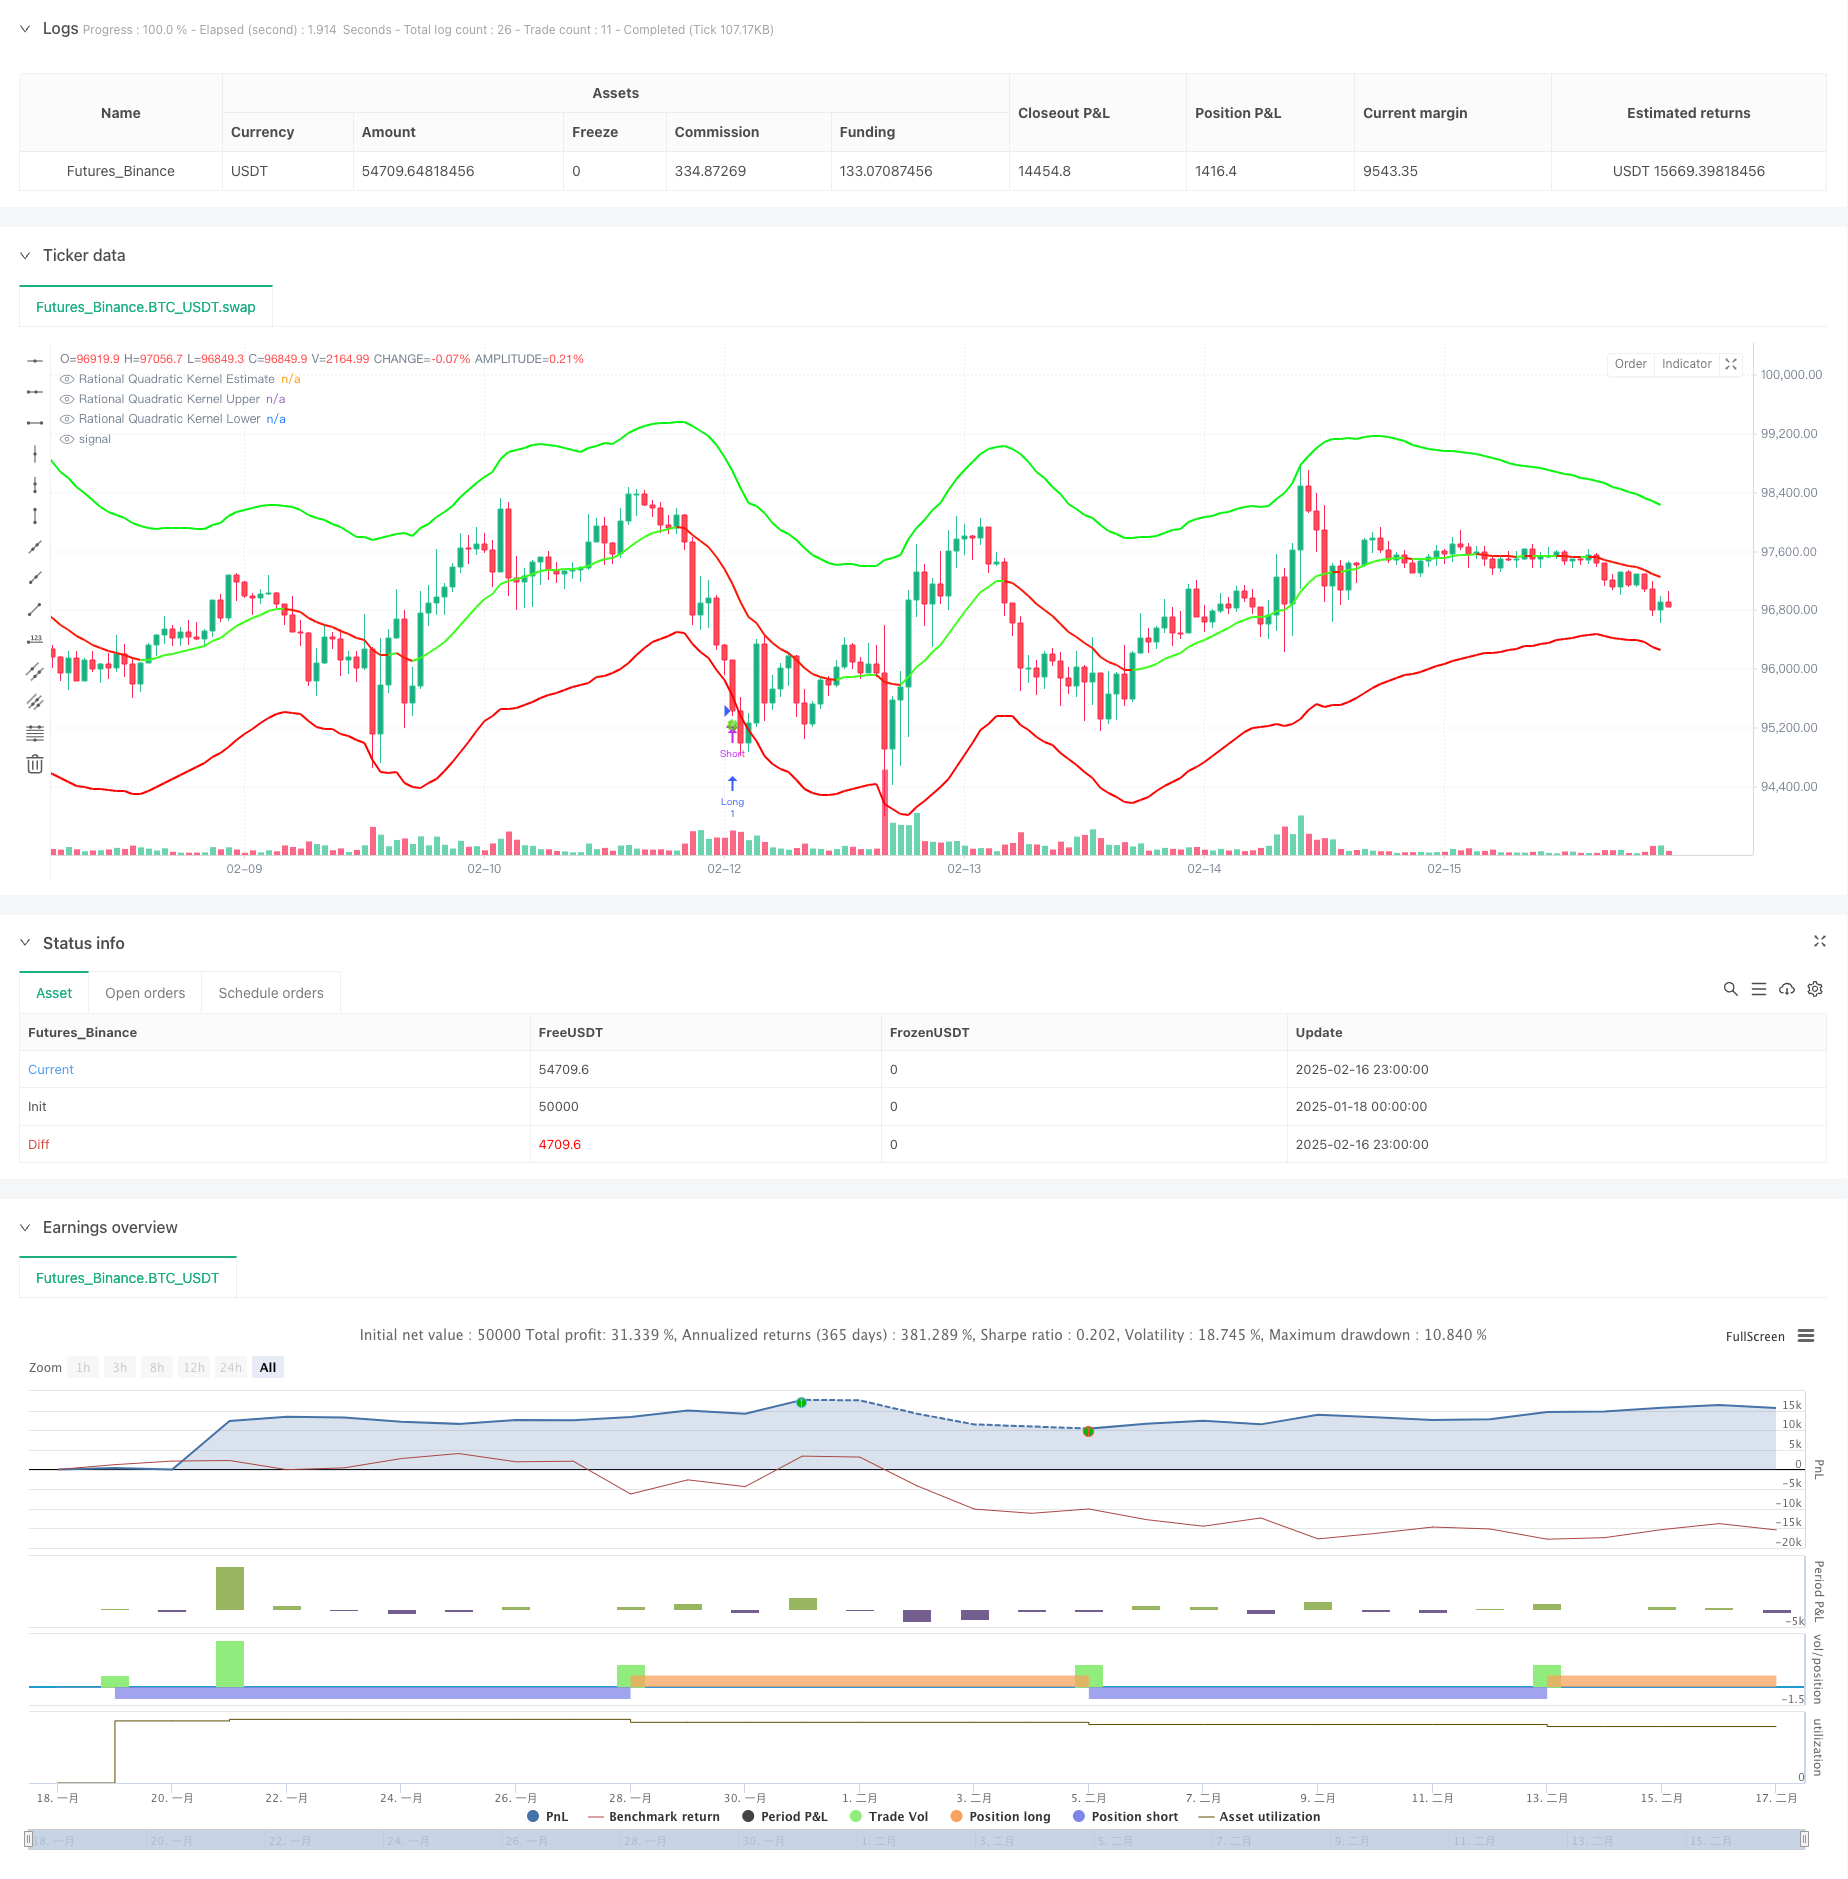
Стратегия представляет собой адаптивную систему отслеживания трендов, которая сочетает в себе ядерную регрессию Надарайя-Уотсона и динамическую полосу ATR. Она прогнозирует ценовые тенденции с помощью логических двойных ядерных функций и использует динамическую поддержку и сопротивление, основанные на ATR, для идентификации торговых возможностей. Система обеспечивает точное моделирование рынка с помощью конфигурируемых регрессивных окон и весовых параметров.
Стратегический принцип
В основе стратегии лежит непарметрическая ядерная регрессия, основанная на методе Надарайя-Уотсона, с использованием рациональных двойных ядерных функций для плавного обработки ценовой последовательности. Регрессия начинается с заданного стартового бара, а также контролируется двумя ключевыми параметрами: lookback window (h) и relative weight ®. При этом в сочетании с ATR-индексами создаются динамические диапазоны, верхние и нижние диапазоны которых, соответственно, возвращаются к оценочной стоимости плюс-минус ATR. Система запускает торговый сигнал через пересечение диапазонов с ценами - когда цена прорывает нижнюю диапазону, она делает больше, а когда она прорывается, делает больше.
Стратегические преимущества
- Метод ядерной регрессии имеет хорошую математическую основу и может эффективно улавливать ценовые тенденции без чрезмерной адаптации
- Динамическая полоса адаптируется к рыночным колебаниям, обеспечивая более разумные позиции поддержки и сопротивления
- Конфигурируемые параметры, гибко адаптируемые к различным рыночным характеристикам
- Гибкий механизм распознавания тенденций с возможностью выбора гладкого или чувствительного режима
- Визуализация интуитивно понятна, сигналы транзакций понятны
Стратегический риск
- Неправильный выбор параметров может привести к переизмеримому или задержке
- Слишком много торговых сигналов может появиться на рынке в условиях колебаний
- Нерациональная настройка ATR может привести к слишком широкой или слишком узкой остановке
- В период смены тренда могут появляться ложные сигналы Рекомендуется оптимизировать параметры с помощью исторической обратной связи и в сочетании с другими показателями в качестве вспомогательного подтверждения.
Направление оптимизации стратегии
- Введение показателя объема сделок в качестве подтверждения тенденции
- Разработка механизма оптимизации параметров адаптации
- Увеличение силы тренда фильтра уменьшает фейковые сигналы рынка колебаний
- Оптимизация механизма остановки убытков для повышения прибыльности
- Рассмотрение возможности включения классификации рынка с использованием различных параметров в различных рынках
Подвести итог
Эта стратегия, объединяя методы статистического обучения с техническим анализом, создает прочную и практичную торговую систему с хорошей теоретической базой. Ее адаптивные свойства и конфигуративность позволяют ей адаптироваться к различным рыночным условиям, но при использовании необходимо обращать внимание на оптимизацию параметров и контроль риска. Благодаря постоянному улучшению и оптимизации эта стратегия может сыграть важную роль в реальных торговых операциях.
/*backtest
start: 2025-01-18 00:00:00
end: 2025-02-17 00:00:00
period: 1h
basePeriod: 1h
exchanges: [{"eid":"Futures_Binance","currency":"BTC_USDT"}]
*/

// This source code is subject to the terms of the Mozilla Public License 2.0 at https://mozilla.org/MPL/2.0/
// © Lupown

//@version=5
strategy("Nadaraya-Watson non repainting Strategy", overlay=true)  // PARAMETER timeframe ODSTRÁNENÝ

//--------------------------------------------------------------------------------
// INPUTS
//--------------------------------------------------------------------------------
src = input.source(close, 'Source')
h   = input.float(8., 'Lookback Window', minval=3., tooltip='The number of bars used for the estimation. This is a sliding value that represents the most recent historical bars. Recommended range: 3-50')
r   = input.float(8., 'Relative Weighting', step=0.25, tooltip='Relative weighting of time frames. As this value approaches zero, the longer time frames will exert more influence on the estimation. As this value approaches infinity, the behavior of the Rational Quadratic Kernel will become identical to the Gaussian kernel. Recommended range: 0.25-25')
x_0 = input.int(25, "Start Regression at Bar", tooltip='Bar index on which to start regression. The first bars of a chart are often highly volatile, and omission of these initial bars often leads to a better overall fit. Recommended range: 5-25')
showMiddle    = input.bool(true, "Show middle band")
smoothColors  = input.bool(false, "Smooth Colors", tooltip="Uses a crossover based mechanism to determine colors. This often results in less color transitions overall.", inline='1', group='Colors')
lag           = input.int(2, "Lag", tooltip="Lag for crossover detection. Lower values result in earlier crossovers. Recommended range: 1-2", inline='1', group='Colors')

lenjeje = input.int(32, "ATR Period",    tooltip="Period to calculate upper and lower band", group='Bands')
coef    = input.float(2.7, "Multiplier", tooltip="Multiplier to calculate upper and lower band", group='Bands')

//--------------------------------------------------------------------------------
// ARRAYS & VARIABLES
//--------------------------------------------------------------------------------
float y1 = 0.0
float y2 = 0.0
srcArray = array.new<float>(0)
array.push(srcArray, src)
size = array.size(srcArray)

//--------------------------------------------------------------------------------
// KERNEL REGRESSION FUNCTIONS
//--------------------------------------------------------------------------------
kernel_regression1(_src, _size, _h) =>
    float _currentWeight = 0.
    float _cumulativeWeight = 0.
    for i = 0 to _size + x_0
        y = _src[i]
        w = math.pow(1 + (math.pow(i, 2) / ((math.pow(_h, 2) * 2 * r))), -r)
        _currentWeight    += y * w
        _cumulativeWeight += w
    [_currentWeight, _cumulativeWeight]

[currentWeight1, cumulativeWeight1] = kernel_regression1(src, size, h)
yhat1 = currentWeight1 / cumulativeWeight1

[currentWeight2, cumulativeWeight2] = kernel_regression1(src, size, h - lag)
yhat2 = currentWeight2 / cumulativeWeight2

//--------------------------------------------------------------------------------
// TREND & COLOR DETECTION
//--------------------------------------------------------------------------------
// Rate-of-change-based
bool wasBearish   = yhat1[2] > yhat1[1]
bool wasBullish   = yhat1[2] < yhat1[1]
bool isBearish    = yhat1[1] > yhat1
bool isBullish    = yhat1[1] < yhat1
bool isBearishChg = isBearish  and wasBullish
bool isBullishChg = isBullish  and wasBearish

// Crossover-based (for "smooth" color changes)
bool isBullishCross  = ta.crossover(yhat2, yhat1)
bool isBearishCross  = ta.crossunder(yhat2, yhat1)
bool isBullishSmooth = yhat2 > yhat1
bool isBearishSmooth = yhat2 < yhat1

color c_bullish    = input.color(#3AFF17, 'Bullish Color', group='Colors')
color c_bearish    = input.color(#FD1707, 'Bearish Color', group='Colors')

color colorByCross = isBullishSmooth ? c_bullish : c_bearish
color colorByRate  = isBullish       ? c_bullish : c_bearish
color plotColor    = smoothColors ? colorByCross : colorByRate

// Middle Estimate
plot(showMiddle ? yhat1 : na, "Rational Quadratic Kernel Estimate", color=plotColor, linewidth=2)

//--------------------------------------------------------------------------------
// UPPER / LOWER BANDS
//--------------------------------------------------------------------------------
upperjeje = yhat1 + coef * ta.atr(lenjeje)
lowerjeje = yhat1 - coef * ta.atr(lenjeje)

plotUpper = plot(upperjeje, "Rational Quadratic Kernel Upper", color=color.rgb(0, 247, 8), linewidth=2)
plotLower = plot(lowerjeje, "Rational Quadratic Kernel Lower", color=color.rgb(255, 0, 0), linewidth=2)

//--------------------------------------------------------------------------------
// SYMBOLS & ALERTS
//--------------------------------------------------------------------------------
plotchar(ta.crossover(close, upperjeje),  char="🥀", location=location.abovebar, size=size.tiny)
plotchar(ta.crossunder(close, lowerjeje), char="🍀", location=location.belowbar, size=size.tiny)

// Alerts for Color Changes (estimator)
alertcondition(smoothColors ? isBearishCross : isBearishChg, title="Bearish Color Change", message="Nadaraya-Watson: {{ticker}} ({{interval}}) turned Bearish ▼")
alertcondition(smoothColors ? isBullishCross : isBullishChg, title="Bullish Color Change", message="Nadaraya-Watson: {{ticker}} ({{interval}}) turned Bullish ▲")

// Alerts when price crosses upper and lower band
alertcondition(ta.crossunder(close, lowerjeje), title="Price close under lower band", message="Nadaraya-Watson: {{ticker}} ({{interval}}) crossed under lower band 🍀")
alertcondition(ta.crossover(close, upperjeje),  title="Price close above upper band", message="Nadaraya-Watson: {{ticker}} ({{interval}}) Crossed above upper band 🥀")

//--------------------------------------------------------------------------------
// STRATEGY LOGIC (EXAMPLE)
//--------------------------------------------------------------------------------
if ta.crossunder(close, lowerjeje)
    // zatvoriť short
    strategy.close("Short")
    // otvoriť long
    strategy.entry("Long", strategy.long)

if ta.crossover(close, upperjeje)
    // zatvoriť long
    strategy.close("Long")
    // otvoriť short
    strategy.entry("Short", strategy.short)