Многопериодный индикатор Дончиана, следующая за трендом и стратегия торговли по дивергенции

Обзор
Эта стратегия основана на показателях тончайского канала с несколькими циклами для построения системы отслеживания тенденций. Анализируя прорывы тончайского канала в разные периоды времени, в сочетании с основными тенденциями и локальными тенденциями, формируется визуально интуитивно понятный график трендовых полос.
Стратегический принцип
В основе стратегии лежит определение трендов на основе показателей Доньчжанского канала. Доньчжанский канал состоит из каналов наивысшей цены и каналов наименьшей цены, и тенденции определяются путем сравнения текущей цены с отношением позиций каналов.
- Основные тенденции: использование 20-циклического коридора Дончжана, когда цены, прорывающиеся вверх, формируют восходящую тенденцию, а, прорывая вниз, формируют нисходящую тенденцию
- Определение локальных тенденций: в рамках основных тенденций, используя более короткий цикл тонцзянского канала, определяется направление локальных тенденций
- Трендовые полосы: формируются через комбинацию 10 различных циклов, цвета более или менее отражают интенсивность тренда
- Торговые сигналы: основной тренд вверх, открытие дополнительных ордеров, основной тренд вниз, открытие пустых ордеров, обратный тренд, когда позиции находятся в убытке
Стратегические преимущества
- Объективное суждение о тренде: суждение о тренде, основанном на ценовом прорыве, избегая искажений, вызванных субъективным суждением
- Многоциклическое подтверждение: повышение точности определения тенденций путем наложения различных циклических тенденций
- Визуальные эффекты интуитивно: цветные изменения в полосе тренда интуитивно показывают состояние рынка
- Ясные правила торговли: четкие сигналы входа и выхода для программирования
- Эластичность: параметры оптимизации стратегии могут быть скорректированы в зависимости от особенностей торговой разновидности
Стратегический риск
- Риск обратного тренда: возможен более крупный отход в точке перехода
- Не применяется для рынка колебаний: колебания поперечных дисков могут создавать ложные сигналы
- Чувствительность параметров: различные параметры могут существенно повлиять на эффективность стратегии
- Влияние скольжения: частые сделки могут быть скольжены
- Системный риск: рыночные сбои могут привести к значительным потерям
Направление оптимизации стратегии
- Увеличение фильтрации силы тренда: введение индикаторов силы тренда, таких как ADX, фильтрация сигналов слабого тренда
- Оптимизированная стоп-настройка: динамическая коррекция стоп-позиции на основе ATR для повышения возможности управления рисками
- Добавление подтверждения количества сделок: комбинированный анализ количества сделок для проверки эффективности тенденции
- Введение адаптации к волатильности: параметры для динамической корректировки волатильности рынка
- Усовершенствование управления позициями: динамическая корректировка размеров позиций на основе силы тренда
Подвести итог
Стратегия использует инновационное применение многоциклических каналов Тунцзяна для создания выделенной визуально и логически четкой системы отслеживания трендов. Основная преимущество стратегии заключается в том, что она визуализирует сложный процесс анализа трендов, что позволяет трейдерам визуально понимать движение рынка. Благодаря разумной оптимизации параметров и мерам контроля риска, стратегия имеет хорошую ценность для реальных применений.
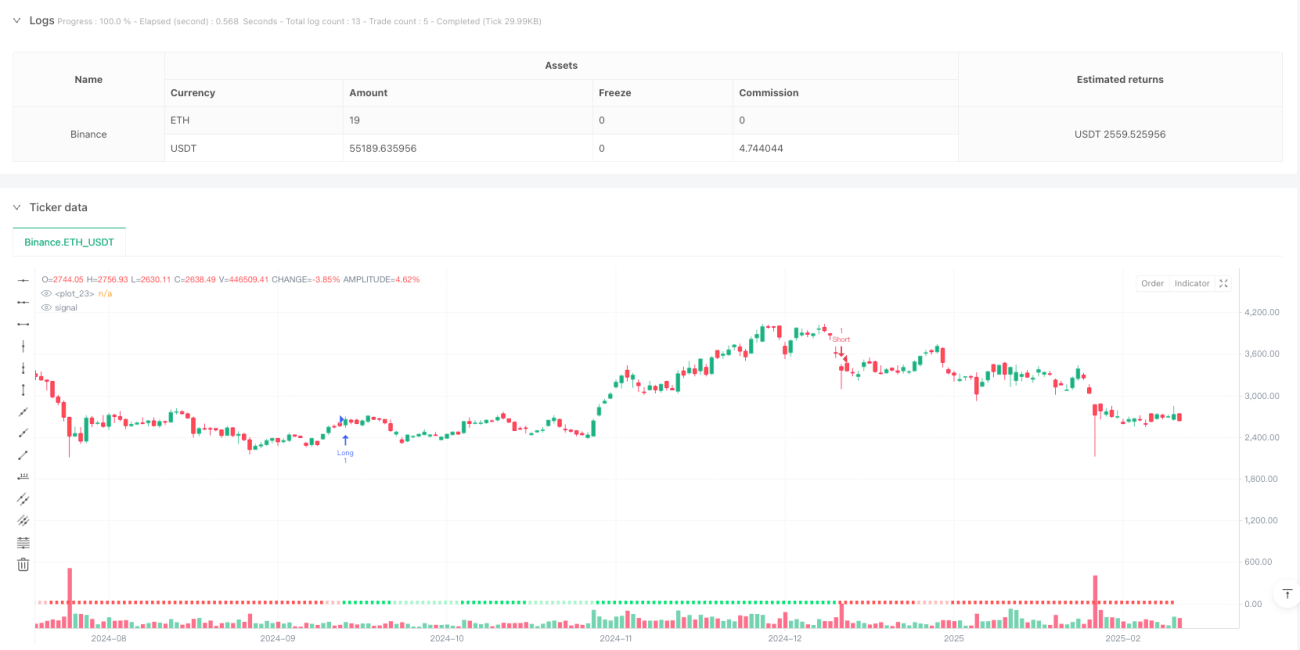
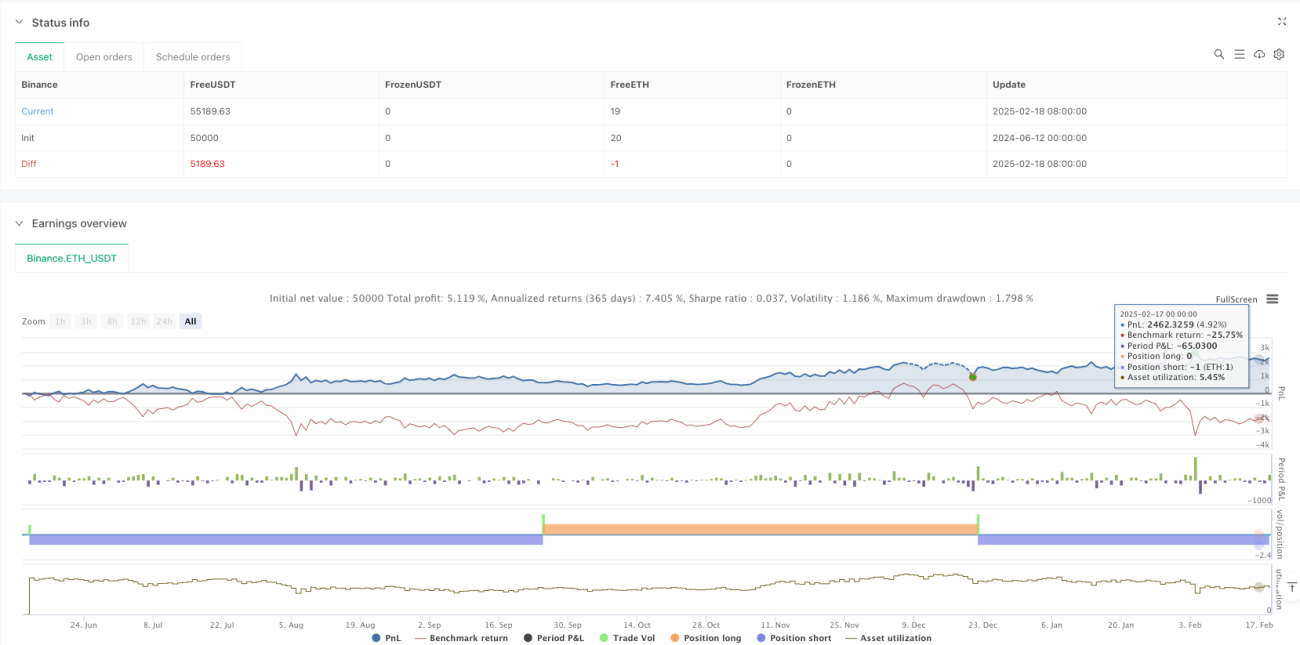
/*backtest
start: 2024-06-12 00:00:00
end: 2025-02-19 08:00:00
period: 1d
basePeriod: 1d
exchanges: [{"eid":"Binance","currency":"ETH_USDT"}]
*/

//@version=6
strategy("Donchian Trend Ribbon Strategy", shorttitle="DonchianTrendRibbonStrat", overlay=true, precision=0)

//~~~~~~~~~~~~~~~~~~~~~~~~~~~~~~~~~~~~~~~~~~~~~~~~~~~~~~~~~~~~~~~~~~~~~~~~~~~~~~- 1